
It is important to remember that penetrometer readings are point-specific and can be labor-intensive for large areas. Spectroscopy, on the other hand, can quickly cover vast tracts of land, identifying general patterns and potential problem areas. The two methods complement each other beautifully.
Discrepancies between the two methods might arise due to variations in soil moisture at the time of measurement. A penetrometer reading will be highly influenced by moisture content, while spectroscopy accounts for it differently in its analysis. Understanding these nuances is key to accurate interpretation.
Ultimately, using both soil compaction spectroscopy and penetrometer readings gives you a comprehensive understanding of your soil’s physical condition. Spectroscopy offers the speed and coverage, while the penetrometer provides precise validation at critical points. This dual approach gives you the best of both worlds for pre-planting soil scan data.
Acting on Compaction Data Before the Growing Season
Once you have identified and mapped your compaction zones using soil spectroscopy, the next critical step is to implement targeted management strategies before planting. Proactive intervention can significantly improve soil health and crop performance throughout the entire growing season. This is where your pre-planting soil scan data really pays off.
Ignoring compaction can lead to poor root growth, reduced nutrient uptake, and decreased water infiltration, costing you yield and resources. Acting decisively based on your soil spectroscopy compaction zones detection results prevents these issues from escalating. It puts you in control of your field’s potential.
- Targeted deep tillage or subsoiling in compacted areas
- Incorporating cover crops with strong taproots to naturally break up hardpans
- Adjusting equipment traffic patterns to avoid re-compaction
- Applying gypsum or other soil amendments to improve soil structure
- Implementing controlled traffic farming systems
- Varying tillage depth and intensity based on compaction severity
- Optimizing planting depth to avoid placing seeds in dense layers
Tracking Compaction Recovery After Tillage or Cover Cropping
Soil spectroscopy is not just for identifying initial compaction; it is also an invaluable tool for tracking the effectiveness of remediation efforts over time. After implementing strategies like deep tillage or planting cover crops, you can use follow-up scans to monitor soil recovery. This allows for continuous improvement in your soil management practices.
Repeat pre-planting soil scan sessions in subsequent seasons will show changes in spectral signatures, indicating whether bulk density has decreased and pore space has improved. A positive shift in the spectral curve suggests that the soil is returning to a healthier, less compacted state. This visual feedback is incredibly powerful for validating your work.
For example, if you used a cover crop with a deep taproot, you should see a gradual return towards the spectral signature of uncompacted soil in subsequent years. This indicates that the roots have successfully broken up the hardpan and improved soil aggregation. It provides concrete evidence of the cover crop’s benefits.
Tracking compaction recovery also helps you fine-tune your practices for different areas of the field. Some zones might respond quickly to intervention, while others require more persistent efforts. Soil compaction spectroscopy enables this nuanced, site-specific management. It allows for truly adaptive farming.
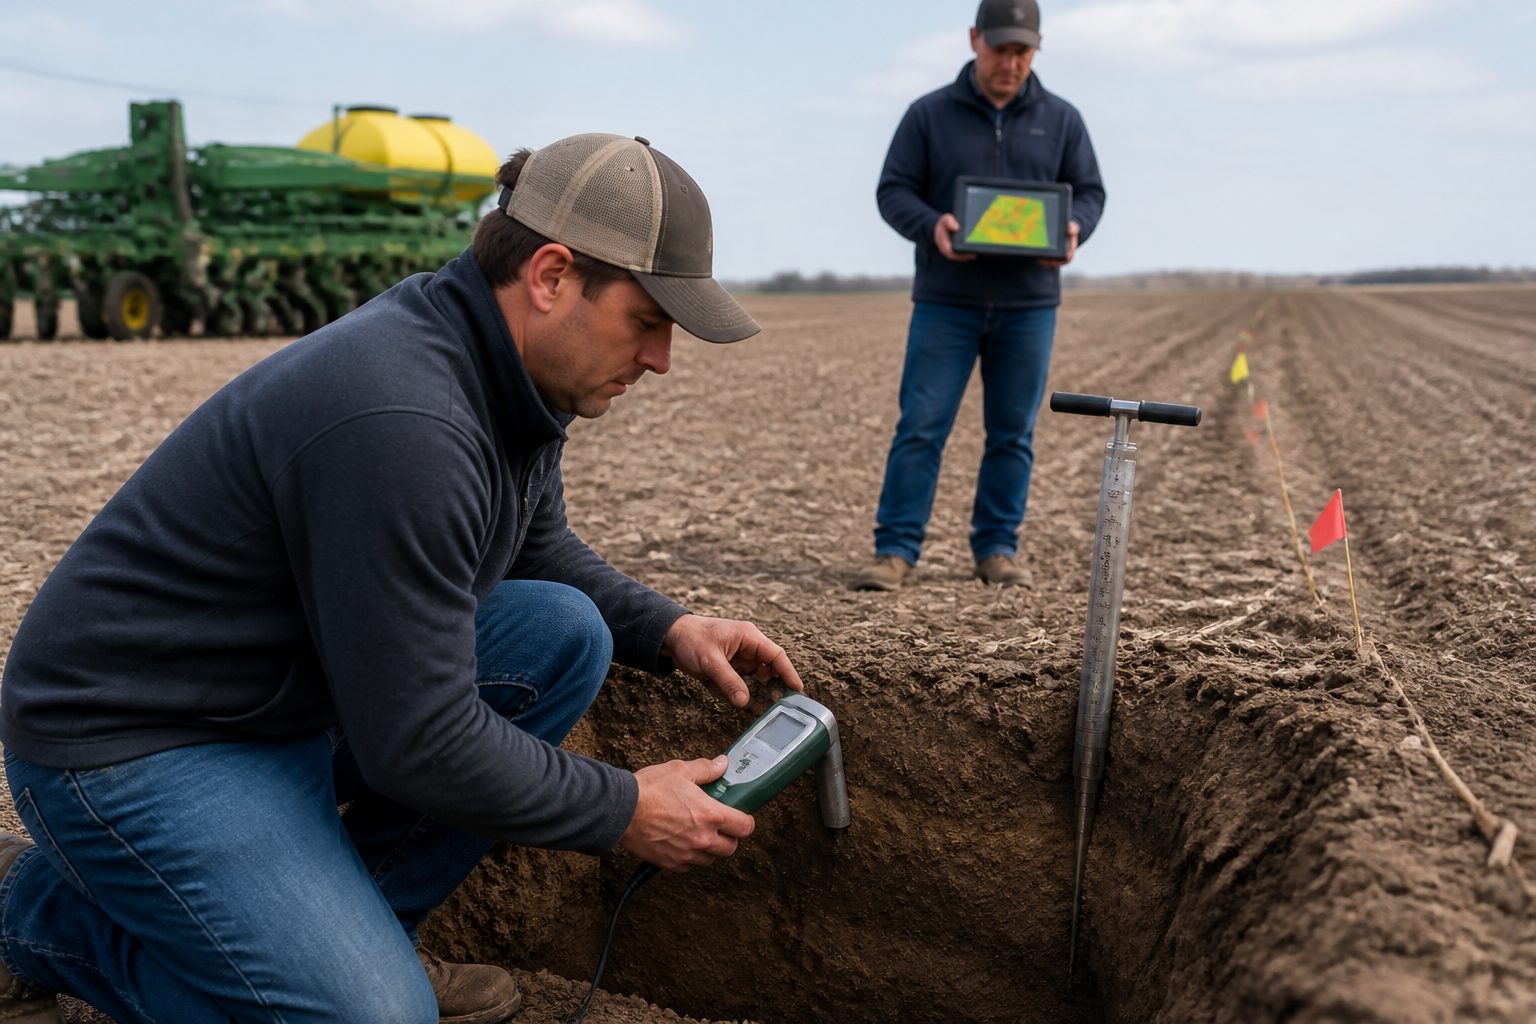
This longitudinal data collection builds a comprehensive history of your field’s soil health, allowing for predictive modeling and better long-term decision-making. You learn which interventions work best under your specific conditions and soil types. It is an investment in the future productivity of your land.
Ultimately, the ability to track recovery using detecting compaction NIR transforms soil management from a reactive process into a proactive, data-driven cycle of improvement. It ensures that your efforts are truly making a difference beneath the surface. This continuous monitoring is a hallmark of precision agriculture.
Conclusion
Identifying compaction zones with soil spectroscopy before planting is a game-changer for modern agriculture. It provides an unparalleled view into the hidden stresses affecting your soil, allowing for precise and timely interventions. This technology moves us beyond guesswork and into data-driven decision-making.
The ability to detect subtle changes in soil spectral signatures related to bulk density and pore structure empowers growers to address compaction proactively. Early detection prevents significant yield losses and promotes healthier, more resilient soil ecosystems. It is a smart investment in the long-term productivity of your farm.
By integrating soil spectroscopy compaction zones detection into your pre-planting routine, you gain a powerful ally in the fight against degraded soil structure. The insights derived from detecting compaction NIR enable targeted tillage, strategic cover cropping, and optimized equipment management. This precision approach truly sets a new standard.
Comparing spectral results with penetrometer readings provides valuable validation, building confidence in your management decisions. This dual approach ensures both broad coverage and pinpoint accuracy in your soil health assessment. It gives you a complete picture of what is happening underground.
Ultimately, the continuous monitoring of compaction recovery through repeated pre-planting soil scan sessions closes the loop on sustainable soil management. It allows farmers to track progress, refine strategies, and continuously improve their land’s health. Embracing soil spectroscopy is embracing the future of farming.
Soil compaction represents a silent thief in agriculture, robbing crops of vital resources and reducing yields before a single seed even sprouts. Farmers often discover these problems too late, seeing stunted growth or poor water infiltration during the growing season. Identifying compaction zones with soil spectroscopy before planting offers a powerful, proactive solution.
This advanced technique uses light to analyze soil properties, providing insights into hidden structural issues that impact root development and nutrient uptake. Employing soil spectroscopy compaction zones detection allows for targeted interventions, saving time and resources compared to traditional methods. It gives growers a clear picture of their field’s health beneath the surface.
Understanding where and why compaction occurs is the first step toward prevention and remediation. By utilizing pre-planting soil scan data, farmers can make informed decisions about tillage, cover cropping, and equipment management. This precision approach leads to healthier soils and more productive harvests.
How Compaction Changes Soil Spectral Signatures
Soil compaction fundamentally alters the physical structure of the soil, impacting how light interacts with it. When soil particles are pressed together, pore space decreases, and bulk density increases, changing the soil’s reflective properties. These changes are precisely what soil compaction spectroscopy can detect and interpret.
Compacted soil typically has lower organic matter content and reduced water infiltration, both of which have distinct spectral responses. Less organic matter means less absorption in certain spectral regions, while altered moisture dynamics affect absorption features across the spectrum. A dense soil block will reflect and absorb light differently than a loose, well-structured soil sample.
The spectral signature of compacted soil often shows a shift in absorption bands related to water and clay minerals. Tightly packed clay particles, for example, can present a different spectral fingerprint than those in an uncompacted state. These subtle variations are critical for distinguishing healthy soil from compromised areas.
Additionally, the surface roughness of compacted soil can differ, influencing the scattering of light. A smoother, more uniform surface, often seen in severely compacted areas, might scatter less light, leading to a stronger, more direct reflectance signal. This physical characteristic directly contributes to the unique spectral signature.
The reduced aeration in compacted zones also impacts microbial activity, which in turn affects organic matter decomposition and nutrient cycling. These biological changes, while indirect, can subtly influence the chemical composition of the soil surface. Spectroscopy picks up on these minute chemical shifts.
Ultimately, the objective is to build a robust library of spectral signatures corresponding to different levels of soil compaction. This allows for accurate soil spectroscopy compaction zones detection, moving beyond visual assessment to data-driven insights. It is a powerful tool for understanding the invisible stresses on your soil.
NIR Indicators of Bulk Density and Pore Structure
Near-Infrared (NIR) spectroscopy is particularly effective for detecting compaction because it interacts strongly with water molecules and organic compounds. Bulk density, a direct measure of compaction, has a strong inverse relationship with pore space, which impacts water holding capacity. Higher bulk density usually means less pore space and therefore less water content in the soil at saturation.
Compacted soils show specific absorption features in the NIR region that relate to bound water and hydroxyl groups in clay minerals. As soil becomes denser, the arrangement of these components changes, altering their spectral response. This makes detecting compaction NIR a reliable method for assessing soil structure.
The spectral signature of water itself is a key indicator; compacted soils often hold less plant-available water, or water is held in different configurations. Changes in the intensity and position of water absorption bands around 1400 nm and 1900 nm can signal variations in soil moisture and pore structure. These precise measurements offer a window into the soil’s physical state.
Organic carbon content also plays a role, as it influences soil aggregation and resilience to compaction. NIR spectroscopy can estimate organic carbon, and lower levels in otherwise similar soils might suggest increased susceptibility to compaction or existing structural damage. This combined analysis strengthens the overall assessment.
Furthermore, the general reflectance curve across the NIR spectrum can indicate overall soil health. A consistently lower reflectance might suggest higher moisture or organic matter, while a higher reflectance could point to drier, more mineral-dominated, and potentially more compacted zones. Interpreting these broad patterns is part of the art and science of spectroscopy.
Researchers are continuously refining models that correlate specific NIR spectral features with direct measurements of bulk density and porosity. This ongoing work improves the accuracy and reliability of soil compaction spectroscopy, making it an increasingly valuable tool for precision agriculture. It provides a non-destructive way to gauge the physical integrity of the soil.
Field Protocol for Scanning Potential Compaction Areas
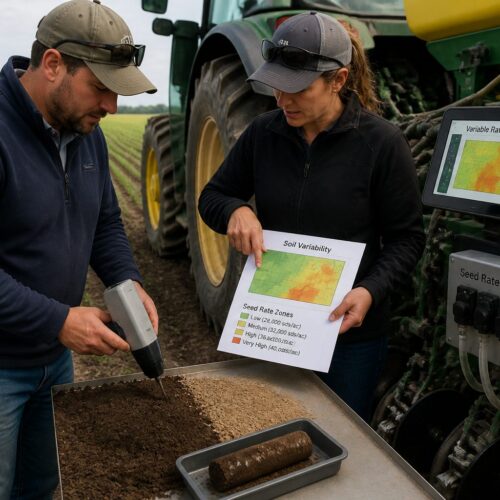
Effective soil spectroscopy compaction zones detection starts with a well-planned field protocol to ensure consistent and accurate data collection. Begin by mapping your field into management zones, considering factors like historical yield data, topography, and previous equipment traffic patterns. This initial mapping helps focus your scanning efforts on high-risk areas.
When conducting the scan, maintain consistent sensor height, speed, and environmental conditions if possible, especially moisture. Collect multiple spectral readings at each sampling point and average them to minimize noise and variability. This meticulous approach guarantees reliable data for analysis.
| Protocol Step | Action Details | Reason for Action |
|---|---|---|
| Field Preparation | Clear surface debris, ensure consistent moisture. | Minimizes spectral interference, improves data quality. |
| Sensor Calibration | Calibrate spectrometer with a white reference panel. | Establishes a baseline for accurate reflectance measurements. |
| Sampling Strategy | Implement grid or transect sampling in suspected zones. | Ensures comprehensive coverage of potential problem areas. |
| Data Collection | Collect multiple scans per point, record GPS coordinates. | Reduces variability, allows for georeferenced mapping. |
| Environmental Notes | Document weather, time of day, and recent rainfall. | Helps interpret spectral variations due to moisture or sun angle. |
| Sample Depth | Consider scanning at surface and shallow depths (e.g., 0-15 cm). | Identifies both surface and sub-surface compaction layers. |
Interpreting Spectral Data to Locate High-Risk Zones
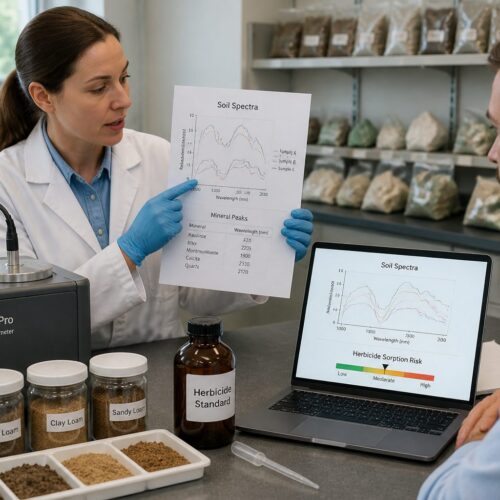
Interpreting spectral data to identify high-risk compaction zones requires specialized software and an understanding of soil science principles. The raw spectral data, a series of reflectance values across different wavelengths, needs processing and analysis to reveal meaningful patterns. This is where the true power of soil spectroscopy compaction zones detection emerges.
Look for deviations from the typical spectral signature of healthy, uncompacted soil within your field. Areas exhibiting higher reflectance in certain visible bands and altered absorption features in the NIR region often indicate denser soil. These shifts are the tell-tale signs of structural degradation.
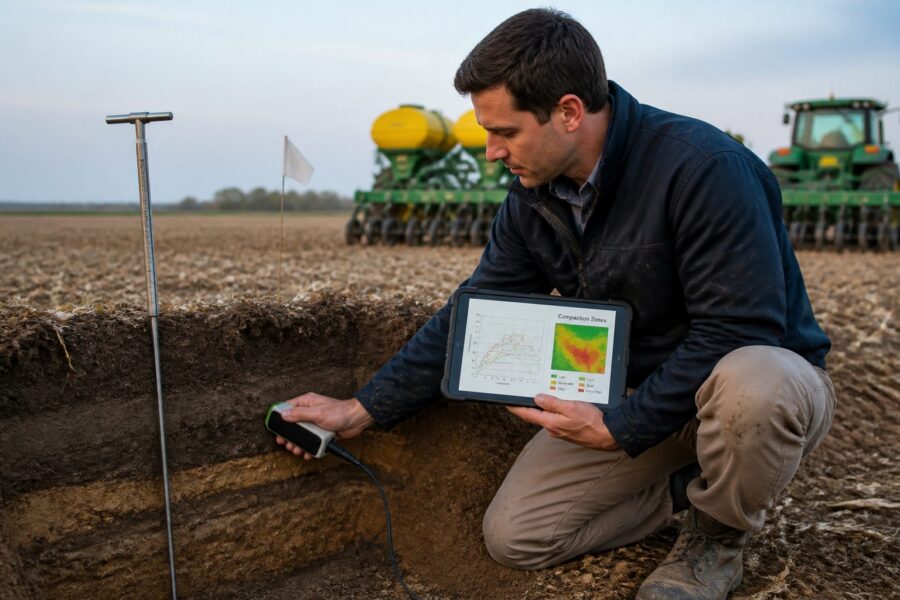
Software algorithms are trained on known samples to correlate spectral data with physical soil properties like bulk density and porosity. These algorithms can generate maps that visually represent the varying levels of compaction across your field. Color-coded maps make it easy to pinpoint problem areas.
Pay close attention to absorption bands associated with water and organic matter. Reduced water absorption or lower estimated organic carbon in specific zones, compared to surrounding areas, strongly suggests compaction. These indicators are crucial for accurate interpretation.
Comparing current spectral maps with historical data, if available, can highlight areas where compaction is worsening or improving over time. This longitudinal analysis provides valuable context for long-term soil management strategies. It helps track the effectiveness of your interventions.
Ultimately, the goal is to translate complex spectral curves into actionable insights for growers. Identifying these high-risk zones allows for targeted remediation efforts, preventing widespread crop issues and optimizing resource allocation. This data-driven approach moves agriculture forward.
Comparing Spectroscopy Results to Penetrometer Readings
While soil compaction spectroscopy provides a broad, non-destructive overview of compaction, it is often beneficial to validate these findings with traditional penetrometer readings. A penetrometer directly measures the resistance of the soil to penetration, offering a tactile confirmation of density. This comparison strengthens the confidence in your spectral analysis.
Penetrometer readings are particularly useful for establishing a ground truth at specific points identified as high-risk by spectroscopy. If your spectral map indicates a compacted zone, a few penetrometer measurements within that zone can confirm the severity and depth of the hardpan. This combined approach offers both breadth and depth in assessment.
Researchers often use penetrometer data to calibrate and refine their spectroscopic models for detecting compaction NIR. By correlating spectral signatures with known penetration resistance values, the accuracy of future spectral predictions improves significantly. This continuous feedback loop is vital for robust scientific tools.
It is important to remember that penetrometer readings are point-specific and can be labor-intensive for large areas. Spectroscopy, on the other hand, can quickly cover vast tracts of land, identifying general patterns and potential problem areas. The two methods complement each other beautifully.
Discrepancies between the two methods might arise due to variations in soil moisture at the time of measurement. A penetrometer reading will be highly influenced by moisture content, while spectroscopy accounts for it differently in its analysis. Understanding these nuances is key to accurate interpretation.
Ultimately, using both soil compaction spectroscopy and penetrometer readings gives you a comprehensive understanding of your soil’s physical condition. Spectroscopy offers the speed and coverage, while the penetrometer provides precise validation at critical points. This dual approach gives you the best of both worlds for pre-planting soil scan data.
Acting on Compaction Data Before the Growing Season
Once you have identified and mapped your compaction zones using soil spectroscopy, the next critical step is to implement targeted management strategies before planting. Proactive intervention can significantly improve soil health and crop performance throughout the entire growing season. This is where your pre-planting soil scan data really pays off.
Ignoring compaction can lead to poor root growth, reduced nutrient uptake, and decreased water infiltration, costing you yield and resources. Acting decisively based on your soil spectroscopy compaction zones detection results prevents these issues from escalating. It puts you in control of your field’s potential.
- Targeted deep tillage or subsoiling in compacted areas
- Incorporating cover crops with strong taproots to naturally break up hardpans
- Adjusting equipment traffic patterns to avoid re-compaction
- Applying gypsum or other soil amendments to improve soil structure
- Implementing controlled traffic farming systems
- Varying tillage depth and intensity based on compaction severity
- Optimizing planting depth to avoid placing seeds in dense layers
Tracking Compaction Recovery After Tillage or Cover Cropping
Soil spectroscopy is not just for identifying initial compaction; it is also an invaluable tool for tracking the effectiveness of remediation efforts over time. After implementing strategies like deep tillage or planting cover crops, you can use follow-up scans to monitor soil recovery. This allows for continuous improvement in your soil management practices.
Repeat pre-planting soil scan sessions in subsequent seasons will show changes in spectral signatures, indicating whether bulk density has decreased and pore space has improved. A positive shift in the spectral curve suggests that the soil is returning to a healthier, less compacted state. This visual feedback is incredibly powerful for validating your work.
For example, if you used a cover crop with a deep taproot, you should see a gradual return towards the spectral signature of uncompacted soil in subsequent years. This indicates that the roots have successfully broken up the hardpan and improved soil aggregation. It provides concrete evidence of the cover crop’s benefits.
Tracking compaction recovery also helps you fine-tune your practices for different areas of the field. Some zones might respond quickly to intervention, while others require more persistent efforts. Soil compaction spectroscopy enables this nuanced, site-specific management. It allows for truly adaptive farming.
This longitudinal data collection builds a comprehensive history of your field’s soil health, allowing for predictive modeling and better long-term decision-making. You learn which interventions work best under your specific conditions and soil types. It is an investment in the future productivity of your land.
Ultimately, the ability to track recovery using detecting compaction NIR transforms soil management from a reactive process into a proactive, data-driven cycle of improvement. It ensures that your efforts are truly making a difference beneath the surface. This continuous monitoring is a hallmark of precision agriculture.
Conclusion
Identifying compaction zones with soil spectroscopy before planting is a game-changer for modern agriculture. It provides an unparalleled view into the hidden stresses affecting your soil, allowing for precise and timely interventions. This technology moves us beyond guesswork and into data-driven decision-making.
The ability to detect subtle changes in soil spectral signatures related to bulk density and pore structure empowers growers to address compaction proactively. Early detection prevents significant yield losses and promotes healthier, more resilient soil ecosystems. It is a smart investment in the long-term productivity of your farm.
By integrating soil spectroscopy compaction zones detection into your pre-planting routine, you gain a powerful ally in the fight against degraded soil structure. The insights derived from detecting compaction NIR enable targeted tillage, strategic cover cropping, and optimized equipment management. This precision approach truly sets a new standard.
Comparing spectral results with penetrometer readings provides valuable validation, building confidence in your management decisions. This dual approach ensures both broad coverage and pinpoint accuracy in your soil health assessment. It gives you a complete picture of what is happening underground.
Ultimately, the continuous monitoring of compaction recovery through repeated pre-planting soil scan sessions closes the loop on sustainable soil management. It allows farmers to track progress, refine strategies, and continuously improve their land’s health. Embracing soil spectroscopy is embracing the future of farming.