Precision agriculture is revolutionizing how we approach crop management. By leveraging advanced technologies, farmers can optimize resource allocation, improve yields, and minimize environmental impact. Soil spectroscopy is emerging as a powerful tool in this precision agriculture toolkit, offering rapid and non-destructive methods for assessing soil properties and plant health.
One of the most promising applications of soil spectroscopy is in the early detection of plant diseases. Traditional methods of disease detection often rely on visual inspection or laboratory analysis, which can be time-consuming and may only identify diseases after they have already caused significant damage. Soil spectroscopy disease detection offers a faster, more proactive approach, enabling farmers to identify and address potential problems before they escalate.
This article will explore the principles behind using soil spectroscopy for disease detection, examine how specific diseases can be identified through spectral analysis, and discuss strategies for integrating this technology into effective disease management programs. We will also address the limitations and challenges associated with this approach, and showcase successful case studies where soil spectroscopy has been used to improve crop health and productivity.
The Principles of Using Soil Spectroscopy for Disease Detection
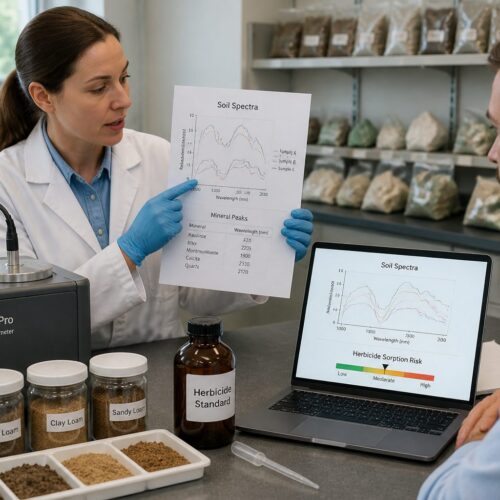
Soil spectroscopy is based on the principle that different substances interact with electromagnetic radiation in unique ways. When light interacts with soil or plant tissue, certain wavelengths are absorbed, while others are reflected or transmitted. The pattern of absorption and reflectance, known as the spectral signature, provides valuable information about the composition and condition of the sample.
In the context of disease detection, soil spectroscopy can identify subtle changes in plant physiology that occur before visible symptoms appear. For example, a plant infected with a fungal pathogen may experience changes in its chlorophyll content, water content, or cell structure, all of which can alter its spectral signature. By analyzing these spectral changes, it is possible to detect the presence of disease even in its early stages.
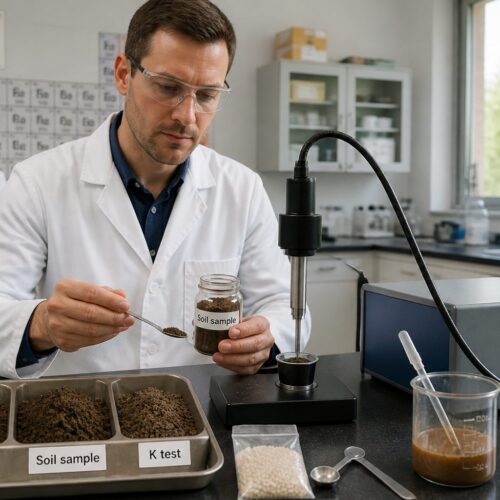
The process typically involves collecting spectral data from soil or plant samples using a spectrometer. This instrument measures the intensity of light reflected or emitted over a range of wavelengths, typically in the visible, near-infrared (NIR), and shortwave infrared (SWIR) regions of the electromagnetic spectrum. The resulting spectral data is then analyzed using various techniques, such as multivariate statistical analysis or machine learning algorithms, to identify patterns associated with specific diseases.
One of the key advantages of soil spectroscopy is its ability to provide rapid and non-destructive measurements. Unlike traditional laboratory methods, which may require destructive sampling and lengthy analysis times, soil spectroscopy can be performed in the field with minimal sample preparation. This allows for real-time monitoring of crop health and timely intervention to prevent disease outbreaks.
Identifying Specific Diseases Through Spectral Analysis
Different plant diseases induce distinct physiological changes, resulting in unique spectral signatures that can be used for identification. For example, fungal diseases often cause changes in leaf chlorophyll content, leading to decreased reflectance in the green region of the spectrum and increased reflectance in the red region. Viral diseases, on the other hand, may affect plant water content and cell structure, resulting in changes in the NIR and SWIR regions.

To identify specific diseases, researchers develop spectral libraries that contain reference spectra for healthy and diseased plants. These libraries are created by collecting spectral data from plants known to be infected with specific pathogens and using statistical methods to identify the spectral features that best distinguish between healthy and diseased plants. Once a spectral library has been established, it can be used to classify unknown samples based on their spectral signatures.
Machine learning algorithms play a crucial role in this process, enabling the development of accurate and robust disease detection models. These algorithms can learn complex relationships between spectral data and disease status, even in the presence of noise and variability. Support vector machines (SVMs), random forests, and artificial neural networks (ANNs) are commonly used for disease classification based on spectral data.
The accuracy of disease identification depends on several factors, including the quality of the spectral data, the size and diversity of the spectral library, and the performance of the machine learning algorithm. It is essential to use high-quality spectrometers and well-designed sampling protocols to minimize noise and variability in the spectral data. Furthermore, the spectral library should include a wide range of plant varieties, growth stages, and environmental conditions to ensure that the disease detection model is robust and generalizable.
Disease-Specific Spectral Signatures
Understanding the spectral fingerprints of specific diseases is crucial for accurate detection. Each disease elicits unique physiological responses in plants, leading to variations in their spectral reflectance patterns. These patterns can be used to differentiate between healthy and infected plants, as well as to identify the specific pathogen causing the infection.
Several factors influence these spectral signatures, including the type of pathogen, the severity of the infection, and the plant’s growth stage. Environmental conditions, such as temperature and humidity, can also affect the spectral characteristics of diseased plants. Therefore, it is essential to consider these factors when developing and applying soil spectroscopy disease detection models.
| Disease | Affected Plant Part | Spectral Changes |
|---|---|---|
| Fusarium Wilt | Vascular System, Leaves | Decreased chlorophyll reflectance, Increased water absorption |
| Late Blight | Leaves, Stems, Fruits | Reduced NIR reflectance, Increased SWIR reflectance |
| Powdery Mildew | Leaves, Stems | Increased reflectance in the visible spectrum, Altered surface texture |
| Soybean Cyst Nematode | Roots, Shoots | Changes in root structure, Reduced chlorophyll content |
Early Detection Strategies for Effective Disease Management
The real power of soil spectroscopy lies in its ability to detect diseases before visible symptoms manifest. This early detection capability enables farmers to implement timely and targeted disease management strategies, minimizing crop losses and reducing the need for broad-spectrum pesticides. By identifying infected plants early on, farmers can prevent the spread of disease to healthy plants and maintain overall crop health.
One effective strategy is to use soil spectroscopy to monitor crop health on a regular basis. This can be done by collecting spectral data from representative samples throughout the growing season and comparing the data to reference spectra for healthy and diseased plants. Any deviations from the healthy spectrum can indicate the presence of disease, prompting further investigation and targeted treatment.
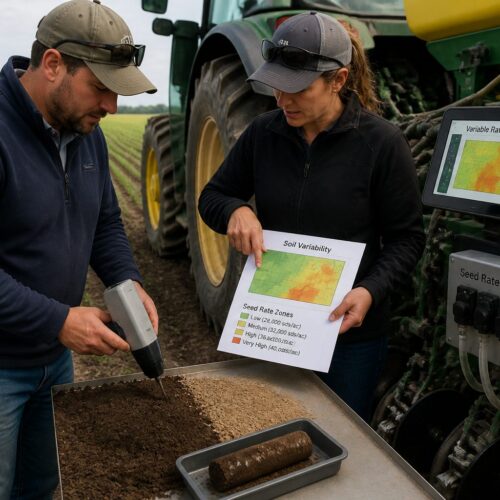
Another approach is to use soil spectroscopy to identify disease hotspots within a field. By mapping the spatial distribution of spectral signatures associated with disease, farmers can identify areas where disease pressure is high and focus their management efforts accordingly. This targeted approach reduces the amount of pesticides needed and minimizes the impact on beneficial organisms and the environment.
In addition to monitoring and mapping, soil spectroscopy can also be used to evaluate the effectiveness of disease management practices. By tracking changes in spectral signatures over time, farmers can assess whether their treatments are working and make adjustments as needed. This feedback loop allows for continuous improvement in disease management strategies and ensures that crops remain healthy and productive.
Integrating Spectroscopy Data with Disease Forecasting Models
Disease forecasting models are valuable tools for predicting the risk of disease outbreaks and guiding disease management decisions. These models typically use weather data, crop characteristics, and historical disease incidence to estimate the likelihood of disease development. Integrating soil spectroscopy data with disease forecasting models can improve their accuracy and reliability, leading to more informed and effective disease management.
Soil spectroscopy data can provide real-time information about crop health and disease status, which can be used to update and refine disease forecasting models. For example, spectral signatures associated with early disease development can be used to increase the predicted risk of disease outbreaks, prompting farmers to take preventive measures. Conversely, spectral signatures indicating healthy crop conditions can be used to decrease the predicted risk, reducing the need for unnecessary pesticide applications.
One approach is to use soil spectroscopy data to calibrate and validate disease forecasting models. By comparing the predicted disease risk with the actual disease status determined by soil spectroscopy, researchers can identify biases and inaccuracies in the models and make adjustments accordingly. This calibration process ensures that the models are accurate and reliable for a specific region and crop.
Another way to integrate soil spectroscopy data with disease forecasting models is to use machine learning techniques to develop hybrid models. These models combine traditional forecasting variables with spectral data to predict disease risk. The machine learning algorithms can learn complex relationships between the various data sources and provide more accurate and reliable predictions than traditional models alone.
Limitations and Challenges of Disease Detection with Spectroscopy
While soil spectroscopy offers significant advantages for disease detection, it is important to acknowledge its limitations and challenges. One of the main challenges is the complexity of spectral data and the need for sophisticated data analysis techniques. Spectral signatures can be influenced by a variety of factors, including soil type, plant variety, growth stage, and environmental conditions, making it difficult to isolate the spectral features specific to disease.
Another challenge is the development of robust and generalizable disease detection models. Spectral libraries need to be comprehensive and representative of the range of conditions under which the models will be applied. This requires collecting spectral data from a wide range of plant varieties, growth stages, and environmental conditions, which can be time-consuming and expensive.
Furthermore, the accuracy of disease detection depends on the quality of the spectral data. Noise and variability in the spectral data can reduce the accuracy of disease classification and lead to false positives or false negatives. It is essential to use high-quality spectrometers and well-designed sampling protocols to minimize noise and variability.
Finally, the cost of soil spectroscopy equipment and data analysis can be a barrier to adoption for some farmers. While the cost of spectrometers has decreased in recent years, they are still a significant investment. Furthermore, the need for specialized expertise in data analysis and model development can limit the accessibility of this technology to smaller farms and resource-constrained communities.
Practical Considerations for Implementing Soil Spectroscopy in Agriculture
Successfully integrating soil spectroscopy into agricultural practices requires careful planning and execution. Farmers must consider various factors, including the type of crops they grow, the diseases they are concerned about, and the resources they have available. A systematic approach is essential to maximize the benefits of this technology.
First, farmers should identify the specific diseases that pose the greatest threat to their crops. This involves consulting with plant pathologists and agricultural extension agents to understand the local disease landscape. Once the target diseases are identified, farmers can focus on developing spectral libraries and disease detection models specific to those pathogens.
- Select appropriate spectroscopy equipment
- Develop a robust sampling strategy
- Create a comprehensive spectral library
- Validate models with field data
- Integrate data into decision-making processes
Case Studies: Successful Disease Detection Applications
Several case studies have demonstrated the effectiveness of soil spectroscopy for disease detection in various crops. For example, researchers have used soil spectroscopy to detect fungal diseases in wheat, including Fusarium head blight and Septoria tritici blotch. By analyzing spectral data from wheat leaves, they were able to identify infected plants before visible symptoms appeared, allowing for timely application of fungicides and reduced yield losses.
In another study, soil spectroscopy was used to detect viral diseases in tomato crops. The researchers found that spectral signatures could distinguish between healthy tomato plants and those infected with Tomato yellow leaf curl virus (TYLCV). This early detection capability allowed farmers to implement vector control measures and prevent the spread of the virus to healthy plants.
Soil spectroscopy has also been used to detect soilborne diseases, such as soybean cyst nematode (SCN). By analyzing spectral data from soil samples, researchers were able to identify areas in the field where SCN populations were high. This information allowed farmers to implement targeted nematode management strategies, such as crop rotation and nematicide application, to reduce nematode damage and improve soybean yields.
These case studies illustrate the potential of soil spectroscopy as a valuable tool for disease detection and management in agriculture. By providing rapid, non-destructive, and early detection capabilities, soil spectroscopy can help farmers improve crop health, reduce pesticide use, and increase profitability.
Future Trends in Soil Spectroscopy for Plant Pathology
The field of soil spectroscopy is constantly evolving, with new technologies and applications emerging regularly. One promising trend is the development of portable and handheld spectrometers that can be used directly in the field. These devices allow farmers to collect spectral data quickly and easily, without the need for laboratory analysis.
Another trend is the integration of soil spectroscopy with remote sensing technologies, such as drones and satellites. By combining spectral data from multiple sources, it is possible to monitor crop health over large areas and identify disease outbreaks at an early stage. This integrated approach enables farmers to make informed decisions about disease management on a field-wide or even regional scale.
Machine learning algorithms are also becoming more sophisticated, allowing for the development of more accurate and robust disease detection models. Deep learning techniques, in particular, have shown promise for analyzing complex spectral data and identifying subtle patterns associated with disease. These advanced algorithms can improve the accuracy and reliability of soil spectroscopy-based disease detection, leading to more effective disease management.
Finally, there is growing interest in using soil spectroscopy to assess the overall health and resilience of crops. By analyzing spectral data, it is possible to identify plants that are stressed or nutrient-deficient, even if they are not yet showing visible symptoms of disease. This proactive approach allows farmers to address underlying health issues and improve the overall resilience of their crops to disease and other stresses.
Conclusion
Soil spectroscopy is a powerful tool for early disease detection in crops, offering a rapid, non-destructive, and proactive approach to disease management. By analyzing spectral signatures, farmers can identify subtle changes in plant physiology that occur before visible symptoms appear, enabling timely intervention and minimizing crop losses. Integrating soil spectroscopy data with disease forecasting models can further improve the accuracy and reliability of disease management decisions.
While there are limitations and challenges associated with this technology, ongoing research and development are addressing these issues and expanding the applications of soil spectroscopy in agriculture. With continued advancements in instrumentation, data analysis techniques, and integration with other technologies, soil spectroscopy has the potential to transform the way we approach plant pathology and improve crop health and productivity worldwide.