
Soil maps used to mean a few lab samples, a lot of interpolation, and a nagging suspicion that the “average” result missed the spots that actually drive yield. Drone flights change that by letting you see soil variation across a whole field in one morning.
When people talk about soil spectroscopy drone mapping, they are talking about measuring how bare soil reflects sunlight across many wavelengths and turning that signal into practical layers you can manage. Done well, it can point you to where to sample, where to lime, and where your “problem areas” are really just different soil.
This is not magic, and it is not a replacement for a shovel, but it can make your sampling and variable rate plans a lot less random. If you are considering UAV soil sensing, you need to understand what the sensors see, what they miss, and how to keep the data honest.
Why drones are changing how we map soil properties
Traditional soil mapping is slow because you pay for lab work and you wait on results, so you naturally limit how many points you collect. That forces you to guess what happens between samples, even in fields with complex soil series.
Even when you grid sample, the grid spacing is usually a compromise between budget and curiosity. A 2.5 acre grid can still miss narrow ridges, old stream channels, and headlands that behave like a different field.
Another problem is that soil properties are not random noise, they are spatial patterns tied to landscape and history. If you do not see the pattern, you can waste money sampling the same zone five times and ignore the zone that needs it.
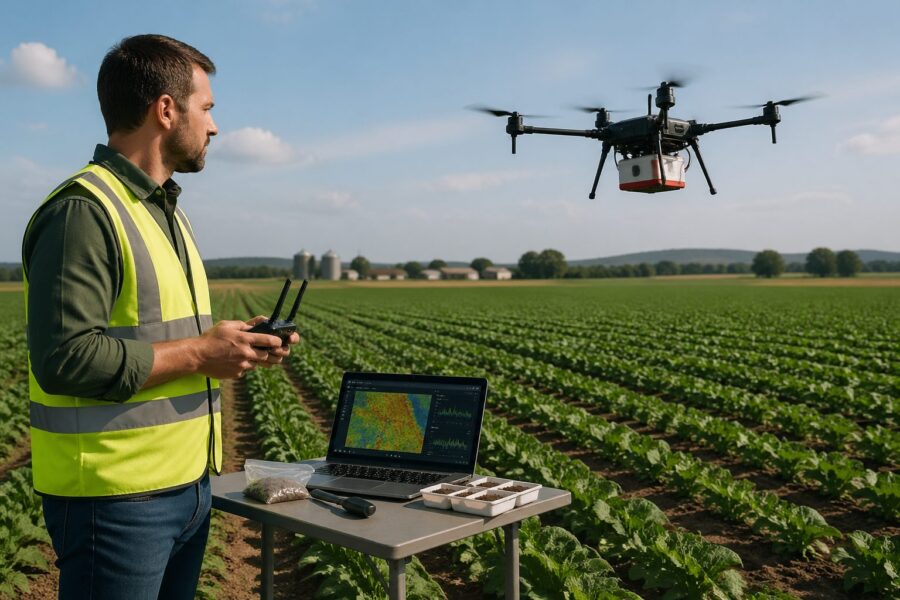
A drone can cover 80 to 200 acres quickly and produce a dense grid of observations, which is the main reason soil spectroscopy drone mapping has momentum. The value is not only the map, it is the confidence that you are not missing a sand ridge or a tight clay pocket.
That density matters because soil boundaries are rarely straight lines, and they rarely match your planter passes. When you can see a boundary curve across a slope, you can design management zones that follow reality instead of a rectangle.
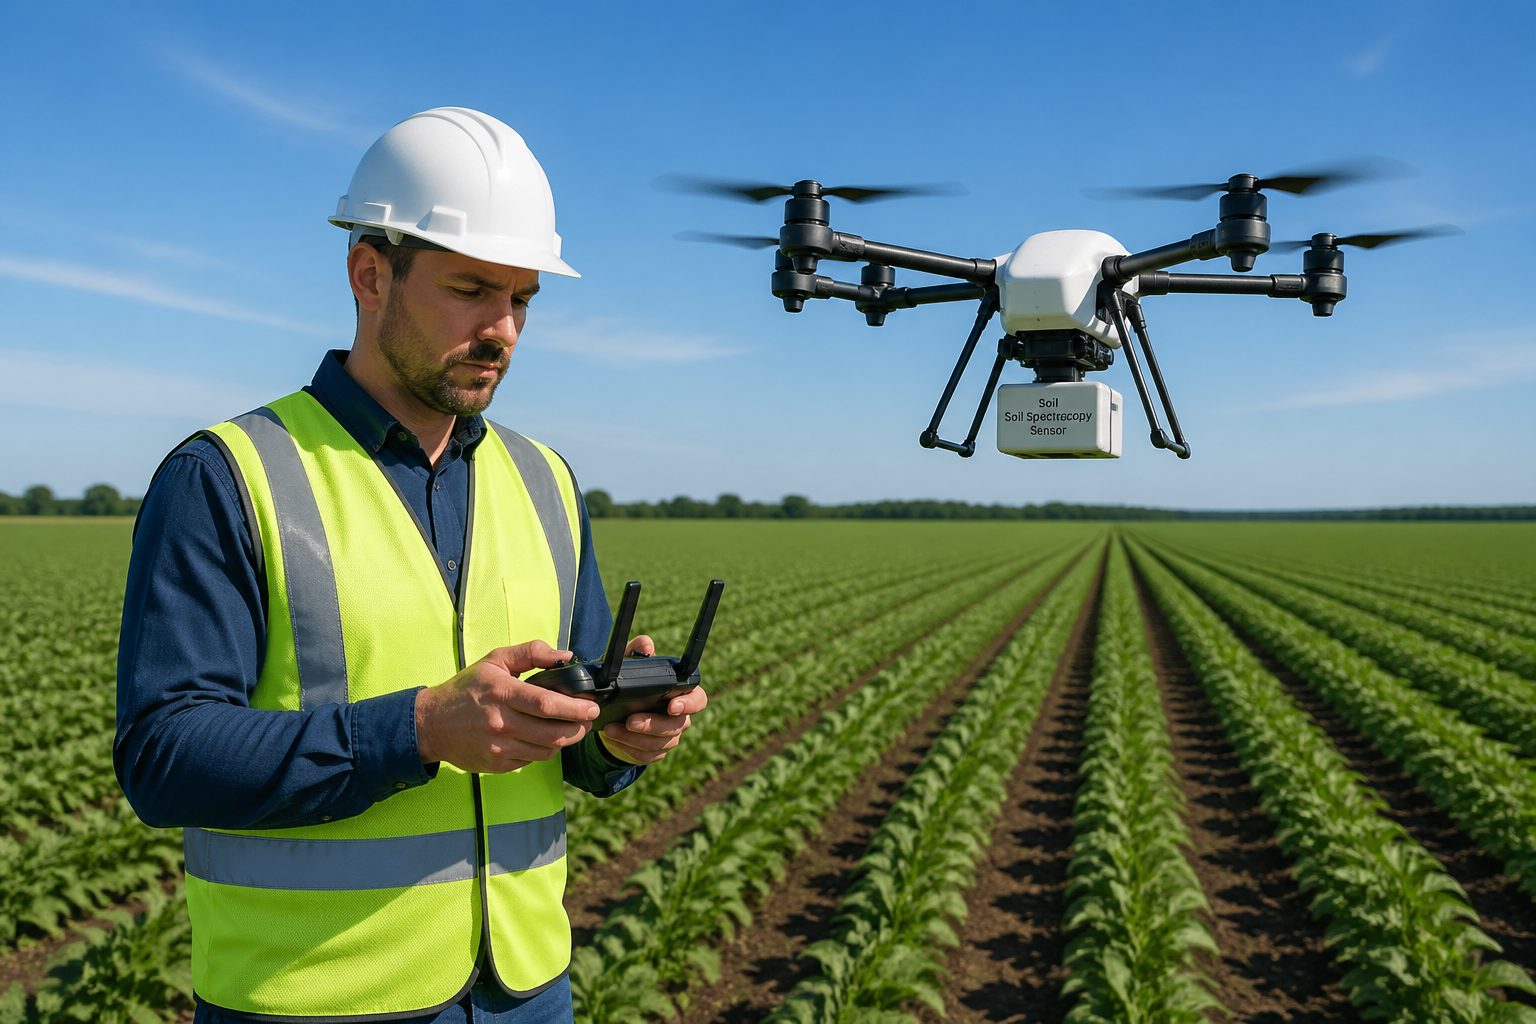
It also changes how you think about variability, because you stop arguing about whether the field is “variable” and start asking where the variability is concentrated. That is a better question because it leads to targeted action.
I like drones for scouting soil differences before I spend money on a big sampling campaign. When you see strong spectral zones, you can stratify your sampling and stop pretending the field is uniform.
In practice, that might mean taking fewer total cores but placing them more intelligently. You can sample the high and low ends of each zone and learn more than you would from a random set of points.
Drones also let you map after tillage or harvest when bare soil is exposed, which is the window when aerial spectral analysis is most useful. That timing matters because residue and canopy are the fastest way to ruin a soil reflectance signal.
If you are in a no till system, the drone still helps, but you may have fewer days where the soil is clean enough to trust the signal. That is why many growers treat drone soil flights as opportunistic and plan to fly when the field happens to be open.
The other change is speed of iteration, because you can fly, process, and ground truth in the same week. That quick loop makes precision field mapping less of a one time project and more of a management habit.
When you can iterate quickly, you can test ideas like “is this low spot actually heavier soil or just wetter today” and get an answer. That kind of feedback is hard to get when your only tool is a lab report that arrives a month later.
Over a few seasons, those repeated looks add up to a field memory that is more detailed than most soil surveys. You start to notice which patterns are stable and which ones move with weather, tillage, and traffic.
How aerial spectroscopy captures soil data at scale
Soil spectroscopy works because minerals, organic matter, moisture, and iron oxides each affect reflectance in predictable ways at certain wavelengths. Aerial spectral analysis measures that reflectance and uses models to estimate properties you care about.
The key idea is that soil is not a flat gray surface, even when it looks that way from the road. Small changes in composition and condition shift the spectrum enough that a sensor can pick up patterns your eye would miss.
In visible bands, darker soils often mean higher organic matter, but shadows and moisture can mimic that effect. In the near infrared and shortwave infrared, absorption features line up more directly with clay minerals, carbonates, and water.
Iron oxides can push soils toward red and yellow tones, which can be useful in landscapes with strong drainage differences. Carbonates can brighten soils and show up in spectral features that are hard to see with simple RGB imagery.
Moisture is both a signal and a confounder, because it is related to texture and structure but also changes day to day. That is why many soil mapping flights aim for consistent moisture conditions, even if that means waiting for the right week.
Scale is where drones shine, because you get thousands to millions of pixels rather than a handful of cores. That density lets you see transitions that a pickup based sampling route will never catch.
It also lets you see within-zone variability, which helps you decide whether a zone is truly uniform enough to manage as one unit. Sometimes the drone reveals that what you thought was a single “clay knob” is actually two different features with different behavior.
Most UAV soil sensing workflows start with reflectance mosaics and then move into indices or full spectrum regression, depending on the sensor. If you only use indices, you should be honest that you are trading accuracy for simplicity.
Indices can still be useful for zoning, because you often care more about relative differences than perfect numbers. The risk is that an index that works on one soil type can flip meaning on another soil type, especially when moisture changes.
Full spectrum methods give you more leverage, but they require more careful calibration and more disciplined processing. They also demand better ground truth, because the model is only as good as the samples you use to teach it.
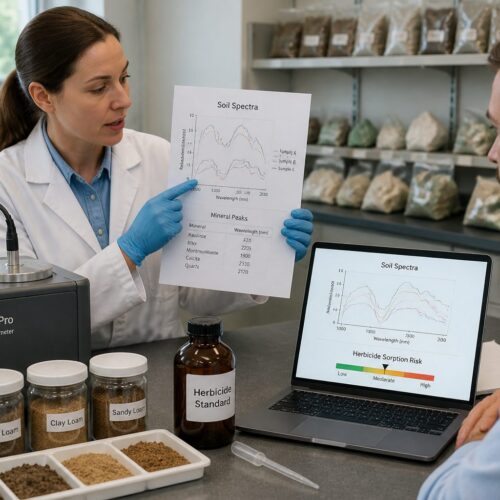
Good soil maps come from pairing the imagery with ground reference points, because spectroscopy without calibration is just pretty colors. If you want the map to hold up across seasons, you need a repeatable method and a consistent flight window.
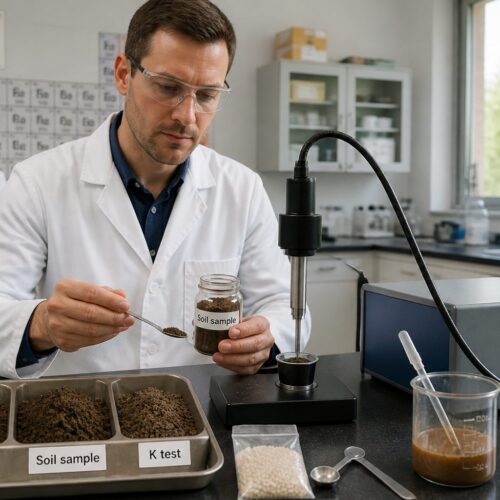
Ground truth does not have to mean dozens of samples per acre, but it does need to represent the full range of soils in the field. If you only sample the easy spots near the road, your model will be confident and wrong.
It also helps to separate what you are mapping into two buckets: stable properties like texture and carbonates, and dynamic properties like surface moisture. Aerial spectroscopy can touch both, but you should not manage them the same way.
Sensor types used in drone-based soil spectroscopy
Choosing a sensor is the first fork in the road, because it sets your cost, your processing burden, and what soil properties you can estimate. For soil spectroscopy drone mapping, you usually pick between multispectral, hyperspectral, and thermal, with LiDAR sometimes added for topography context.
The sensor choice also affects how picky you have to be about flight conditions. A basic RGB camera can tolerate more variation, while hyperspectral sensors punish sloppy lighting and inconsistent calibration.
Multispectral is cheaper and easier, but it samples a few wide bands, so you rely more on indices and empirical correlations. Hyperspectral is more demanding, yet it can capture narrow absorption features that tie more directly to mineralogy and moisture.
RGB is often dismissed, but it can still be a workhorse for surface cues like erosion scars, old tile lines, and residue distribution. If you are just trying to understand where the field changes, RGB plus elevation can get you surprisingly far.
Multispectral cameras are popular because they fit into existing drone workflows and software. They also tend to have better support for reflectance calibration, which matters more than people think when they are starting out.
Hyperspectral sensors can be transformative on the right project, but they are not forgiving. You need stable flight speed, good overlap strategy, and a processing pipeline that can handle large data volumes without cutting corners.
Thermal is not soil spectroscopy in the strict sense, but it can reveal patterns tied to moisture and compaction. On bare soil, thermal differences often show drainage and texture patterns that match what you see after a heavy rain.
LiDAR does not measure reflectance, yet it can be the missing layer that explains why spectral zones exist. A few inches of elevation change can control water movement, and water movement controls a lot of what you see in soil signals.
| Sensor type | Typical bands and examples | Best fit for soil mapping |
|---|---|---|
| RGB | Red, green, blue, standard cameras | Residue cover checks, erosion features, surface texture cues |
| Multispectral | 5 to 10 bands, examples include MicaSense RedEdge | Organic matter proxies, bare soil zoning, quick precision field mapping |
| Hyperspectral | 50 to 300+ narrow bands, examples include Headwall Nano-Hyperspec | Clay and carbonate signals, detailed mineralogy patterns, stronger modeling |
| Thermal | Longwave infrared, examples include FLIR sensors | Moisture related patterns, drainage issues, irrigation diagnostics on bare soil |
One practical way to choose is to start with the decision you want to make, not the sensor you want to own. If your goal is lime zoning, multispectral plus good sampling often beats hyperspectral with weak ground truth.
Another practical factor is support, because the best sensor is the one you can keep calibrated and processing correctly. If you cannot get consistent reflectance outputs, the extra bands do not help you.
It is also worth thinking about payload and flight time, because heavier sensors shorten missions and complicate logistics. If your drone can only fly 15 minutes with the sensor, you may end up with inconsistent mosaics from too many battery swaps.
Planning a drone mapping mission for your fields
Start with timing, because bare soil is the admission ticket for UAV soil sensing. Fly after harvest, after tillage, or before emergence, and avoid days when residue or weeds cover more than a small fraction of the surface.
If you have multiple fields, prioritize the ones with the most visible variability or the biggest management decisions coming up. A clean flight on one representative field can teach you more than rushed flights on five fields.
Moisture timing is a quiet lever you can pull, because consistent moisture makes maps easier to compare. Many operators aim for a few days after a rain when the surface has dried but the profile still shows drainage differences.
Pick a flight altitude that gives you the ground sample distance you need, not the one that feels convenient. For most soil zoning work, 2 to 5 cm pixels are enough, while hyperspectral often trades resolution for signal quality.
Higher resolution is not always better, because it can amplify micro-shadows from clods and ridges. If your goal is management zones, you usually want the dominant pattern, not every footprint and tire track.
Light conditions matter more than new drone pilots expect, and I avoid partly cloudy days even if the forecast says “mostly sunny.” Passing clouds create radiometric seams that can look like soil boundaries in the final mosaic.
Midday flights reduce long shadows, but they can increase glare on certain soil surfaces. Early afternoon often works well because the sun angle is high and the light is stable, assuming the wind is not ripping.
Overlap is not optional, and you should plan at least 75 percent forward overlap and 70 percent side overlap for clean mosaics. If you run a pushbroom hyperspectral sensor, follow the manufacturer’s guidance, because overlap and speed interact differently than with frame cameras.
Do not forget about flight direction, because consistent sun-sensor geometry can reduce striping and banding. If you can, fly lines that keep the sun roughly to the side rather than directly in front of the camera.
Wind is not just a safety issue, it is a data quality issue. Gusts change altitude and attitude, which changes ground sampling distance and can introduce blur that looks like noise in the spectral layers.
Ground control points help with geometry, but they also help you align soil maps with yield maps and guidance lines later. If you skip them, expect more time spent nudging layers around in GIS.
Even a small number of well-placed control points can improve consistency across seasons. The goal is not perfection, it is making sure your soil zones land on the right side of the terrace and not ten feet off.
Finally, plan for ground truth on the same day if possible, because conditions change fast. If you wait two weeks to sample, moisture and surface condition may shift enough that you are no longer validating the same signal.
Processing and interpreting spectral data from UAV flights
Processing begins with radiometric correction, because raw digital numbers are not reflectance and they drift with exposure and sun angle. If your workflow skips this step, your soil spectroscopy drone mapping results will be fragile and hard to repeat.
Radiometric correction is also where you decide whether you are building a map for this field on this day or a layer you want to compare year to year. If you want repeatability, you need to treat calibration as part of the product, not an optional feature.
Next comes orthomosaic generation, which stitches images into a map and corrects for lens distortion and terrain. This is where poor overlap or wind gusts show up as blur, warping, or seams that ruin precision field mapping.
It is worth inspecting the mosaic at full resolution before you do any modeling. If the base map has seams, you will end up modeling seams, and the output will look scientific while being wrong.
Once you have reflectance layers, you can build indices, run a partial least squares regression, or use machine learning with ground truth samples. I prefer simple models first, because complicated models can overfit and look “accurate” until you test them on a different field.
A simple approach can be as basic as clustering the reflectance data into a few zones and then sampling each zone. That is not glamorous, but it often produces actionable management maps faster than chasing perfect property estimates.
If you do build predictive models, keep a portion of your samples out for validation. It is easy to fool yourself when the model is graded on the same points you used to train it.
Interpretation should start with sanity checks, like comparing zones to known soil survey boundaries, elevation, and drainage patterns. If your map says the hilltop is wetter than the bottom, your model is probably chasing shadows.
Another sanity check is to compare the soil map to recent yield maps and to imagery from a crop canopy later in the season. If the patterns never show up in yield or crop stress, you may be mapping surface condition rather than meaningful soil differences.
Do not treat the map as a lab report, because it is a spatial prediction with uncertainty. The best use is to direct targeted sampling and management zones, then confirm with a few cores where the map makes a strong claim.
When you ground truth, take notes on texture by feel, structure, compaction, and depth to restrictive layers, because those factors often explain yield better than any single lab number. The drone can guide you to the right spots, but your shovel tells you what is actually happening.
Once you trust the zones, smooth them into shapes that equipment can run without creating a jagged prescription. A map that is technically detailed but operationally impossible is just a screenshot.
Calibrating drone sensors for accurate soil readings
Calibration is where many UAV soil sensing projects quietly fail, because people trust factory settings and hope for the best. Soil reflectance is sensitive to sun angle, haze, and sensor temperature, so you need a routine you can repeat.
The goal of calibration is not to impress anyone, it is to make your data comparable across flights. If you cannot compare April to October, you cannot build confidence that the zones are real.
Use a calibrated reflectance panel at the start and end of each flight, and take the images at the same exposure settings you use in the air. If your sensor has a downwelling light sensor, treat it as helpful but not a replacement for panel measurements.
Panel images are also a quick way to catch mistakes like a smudged lens or a wrong exposure mode. If the panel values look off, it is better to refly than to spend hours processing bad data.
Try to keep the panel clean and handle it like a measurement tool, not like a piece of plastic in the truck. Dust and scratches change reflectance, and that error carries through your entire map.
If you fly multiple batteries, pay attention to whether the sensor warms up and drifts. Some systems are stable, but others can shift enough that early and late flight lines look like different soils.
- Capture reflectance panel images before takeoff and after landing
- Lock exposure when possible to reduce frame to frame drift
- Record sun angle, cloud cover, and wind in field notes
- Verify focus and lens cleanliness before every mission
- Collect a small set of ground truth samples in high and low reflectance zones
- Recheck calibration after firmware updates or sensor repairs
Field notes sound old fashioned, but they save you when you are comparing flights months later. If you know one flight happened after a light rain and another happened after a week of dry wind, you will interpret differences more honestly.
Calibration also includes the human side, like using the same processing settings each time. If you change software, update firmware, and switch reflectance workflows all at once, you will not know what caused the differences you see.
When you build models, document which samples were used and how they were collected. A model built on 0 to 2 inch samples can behave differently than one built on 0 to 6 inch samples, even if the lab numbers look similar.
Integrating aerial soil maps with your farm management system
A soil map that lives on someone’s laptop does not change how you farm, so integration is the real finish line. Export your layers in GeoTIFF or shapefile formats that your GIS, display, or platform already accepts.
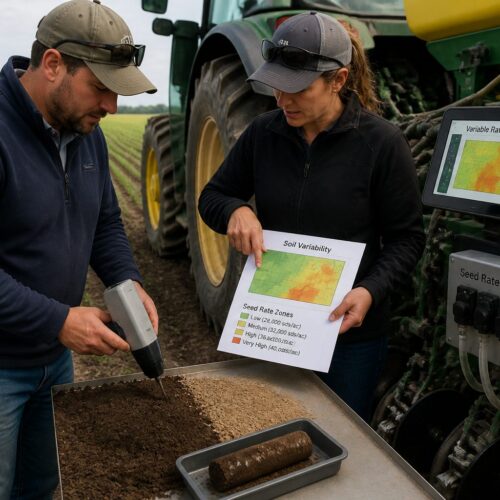
Before you export, decide whether the map is a raster you want to keep continuous or a set of zones you want to manage. Most equipment runs zones more reliably than it runs a high-resolution continuous surface.
Most farm management systems can ingest zone maps for variable rate lime, variable rate seeding, or targeted tissue sampling plans. The practical move is to convert continuous raster outputs into a few management classes you can actually execute.
If you are making classes, keep them stable across years so you can learn from them. Changing zone breaks every season makes it hard to tell whether management improved anything or you just changed the map.
Align the soil zones with your yield history, because yield often explains whether a spectral zone matters economically. If a zone is spectrally distinct but yields the same as the rest of the field, you may not need to treat it differently.
Yield history also helps you avoid chasing patterns that are only cosmetic. A bright patch of soil might look dramatic in imagery, but if it never shows up in yield or crop stress, it may not deserve a separate prescription.
Use the soil map to plan sampling points, then store those points and lab results back into the same field record. Over time you build a tighter model, and your soil spectroscopy drone mapping layers stop being a one off experiment.
It helps to tag samples by zone so you can summarize results in a way that matches how you manage. Instead of a spreadsheet of points, you get zone averages and ranges that translate into decisions.
If you run strip trials, soil zones are a good way to block the design so you do not confuse soil variability with treatment effects. That is the kind of boring detail that makes precision field mapping pay off.
Zones can also guide where you place check strips and where you push rates, because you can test whether a response is consistent across soil types. That makes your trials more informative without making them more complicated.
Finally, keep a versioned archive of your maps and prescriptions. When someone asks why a rate changed, you want to be able to point to the data and the date, not your memory.
Limitations and sources of error in drone spectroscopy
The biggest limitation is that spectroscopy sees the surface, not the full profile, so tillage depth and surface condition matter a lot. A field with fresh chisel plow ridges can reflect light differently than the same soil rolled smooth.
That surface sensitivity is why two flights a week apart can disagree even when the underlying soil did not change. If you worked the field, dragged manure, or had a crust form, the sensor will notice.
Moisture is a constant troublemaker, because wet soil darkens and shifts absorption features in ways that can look like higher organic matter or different texture. If you fly after a rain, you are mapping moisture patterns as much as soil properties.
Even dew can matter on certain mornings, especially on fine-textured soils that hold water at the surface. If you see a weird gradient that matches the sun drying pattern, that is a clue you flew too early.
Residue and cover crop trash can dominate the signal, especially in no till systems, and you end up mapping corn stalk density. If you cannot get bare soil, you may need to switch to indirect layers like topography and electrical conductivity.
Some operators try to mask residue using RGB classification, but that can remove the very areas you care about. A patchy mask can also create artificial edges that look like real soil boundaries.
Shadows from trees, terraces, or even your own sensor mount can create false zones in aerial spectral analysis. You can mask shadows, but heavy masking reduces coverage and makes the final map patchy.
Sun angle changes across the day also changes shadow behavior, which is why consistent flight timing matters. If you fly one half of the field at 10 a.m. and the other half at 2 p.m., you can create a seam that is hard to remove.
Model transfer is another issue, because a calibration built on one farm may not work on the next farm with different parent material. If someone promises a universal model for soil spectroscopy drone mapping, ask how many soil types and states they tested.
Even within a farm, a model built on one field can struggle on another field if drainage class and mineralogy shift. That is why zone-based sampling and local calibration usually beat one-size-fits-all promises.
There is also the simple limitation of depth, because many management decisions depend on subsoil constraints. A drone can hint at those constraints indirectly, but it cannot replace digging a few holes where the map looks suspicious.
Cost considerations and return on investment for small farms
Costs range widely, and the honest answer is that hyperspectral rigs can get expensive fast while multispectral can be approachable. A capable drone, a multispectral camera, and software subscriptions can still run several thousand dollars, before you count your time.
Time is not a footnote, because the learning curve is real. If you spend ten evenings fighting mosaics and calibration, that is a cost even if it never shows up on an invoice.
For small farms, hiring a service provider for one or two flights can make more sense than owning the gear. You pay for the map, but you also pay for the operator’s experience with UAV soil sensing, which is often the difference between usable and noisy data.
A good provider should be willing to explain their calibration routine and show examples of how they validated results. If they cannot tell you how they handle reflectance correction, you are buying a picture, not a measurement.
ROI usually comes from better lime placement, fewer wasted grid samples, and catching drainage or compaction zones that you can fix with targeted work. If variable rate lime saves you even 10 to 20 dollars per acre on the acres that do not need it, the math can work quickly.
Another ROI path is reducing the number of lab samples while keeping confidence in the map. If a drone-derived zone map lets you cut a 1-acre grid down to zone sampling without losing decisions, that is real money saved.
There is also value in avoiding the wrong fix, like ripping a field for compaction when the real issue is a texture change and poor drainage. A good map can keep you from spending money on steel that never had a chance to help.
I would not buy equipment for soil spectroscopy drone mapping unless you can commit to multiple flights per year and you have a plan for ground truth sampling. Without that, you end up with pretty maps and no management change.
Owning the gear makes more sense when you already use a drone for stand counts, scouting, or drainage checks. If the drone is already part of your operation, adding soil flights can be an incremental step instead of a new hobby.
A good middle path is to start with a contractor, then purchase gear only after you know which sensor type pays on your soils. That approach also lets you compare your results to lab tests and decide what accuracy you actually need.
If you do invest, budget for training, calibration targets, and a workflow you can repeat, not just the hardware. The hidden cost in UAV soil sensing is inconsistency, because inconsistent data forces you to redo work and second-guess decisions.
Conclusion
Drone mapping can make soil variability visible in a way that paper surveys and sparse sampling rarely do. The best results come when you treat aerial spectral analysis as a guide for smarter ground work, not as a replacement for it.
The technology is most useful when it helps you ask better questions, like where to sample next and which zones deserve separate management. When you use it that way, it becomes a practical tool instead of a science project.
If you want soil spectroscopy drone mapping to hold up, focus on timing, calibration, and a clean processing workflow that you can repeat next season. When you connect those maps to real management actions, precision field mapping stops being a tech demo and starts paying bills.
The win is not a perfect map, it is a better decision with fewer wasted inputs and fewer surprises at harvest. If you keep the workflow honest and keep a shovel in the loop, drones can earn their place in your soil management toolkit.