
Precision agriculture is revolutionizing how we manage crops, and one of the most promising tools in this revolution is soil spectroscopy. By analyzing the interaction of light with soil samples, we can gain valuable insights into soil composition and, consequently, plant health. This knowledge allows for more targeted and efficient agricultural practices, ultimately leading to increased yields and reduced environmental impact.
Effective soil spectroscopy crop monitoring empowers farmers to make data-driven decisions, optimizing resource allocation and mitigating potential problems before they escalate. This comprehensive guide will explore the basics of crop monitoring using soil spectroscopy, its applications, and future trends.
We’ll examine how spectral analysis can identify plant stressors, assess crop health, and integrate with remote sensing technologies. Real-world case studies will illustrate the power of this technology, paving the way for a more sustainable and productive agricultural future.
The Basics of Crop Monitoring with Soil Spectroscopy
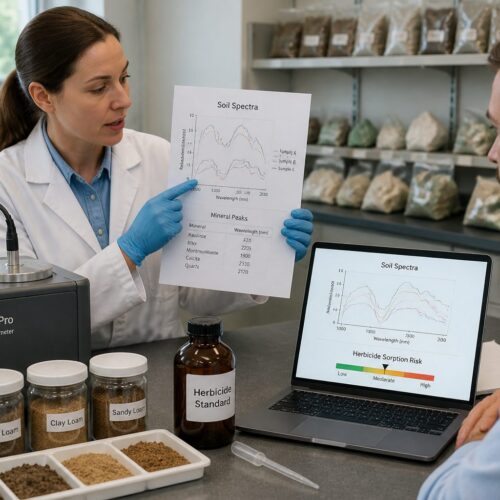
Soil spectroscopy is a technique that measures the reflectance and absorbance of light by soil samples. Different soil components, such as minerals, organic matter, and moisture, interact with light in unique ways. Analyzing these interactions provides a “spectral fingerprint” of the soil, revealing its chemical and physical properties.
This spectral fingerprint can then be correlated with various plant health indicators, such as nutrient availability, water content, and disease presence. Unlike traditional soil testing methods, which are often time-consuming and expensive, soil spectroscopy offers a rapid and cost-effective alternative.
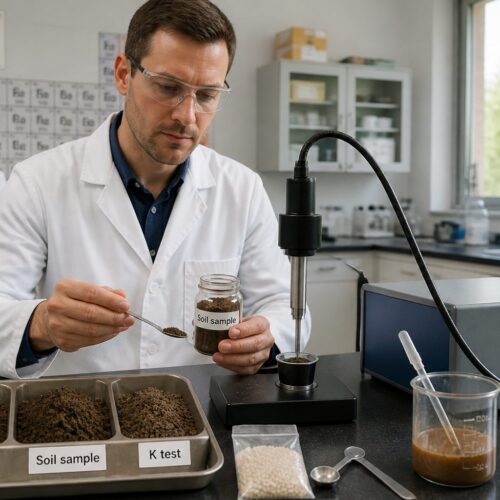
The process typically involves collecting soil samples from the field and analyzing them using a spectrometer. Spectrometers emit light across a range of wavelengths and measure the amount of light that is reflected or absorbed by the sample. The resulting spectral data is then processed using specialized software to extract relevant information about the soil’s composition.
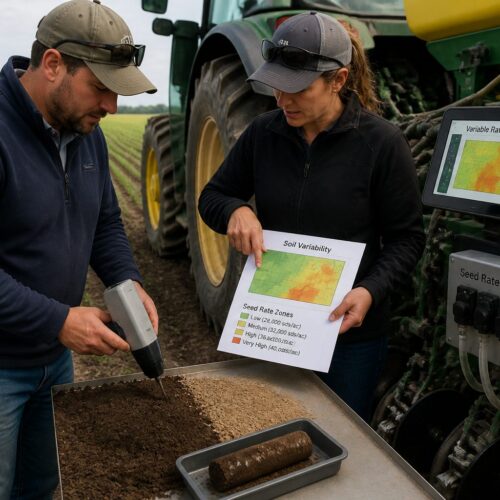
This information can be used to create maps of soil properties across the field, allowing farmers to identify areas with nutrient deficiencies or other issues that may be impacting crop growth. This targeted approach to crop management ensures that resources are applied where they are needed most, maximizing efficiency and minimizing waste.
In more detail, the spectrometer shines a beam of light onto the soil sample. The light interacts with the soil particles, and some of it is absorbed, while the rest is reflected. The spectrometer then measures the intensity of the reflected light at different wavelengths, creating a spectrum.
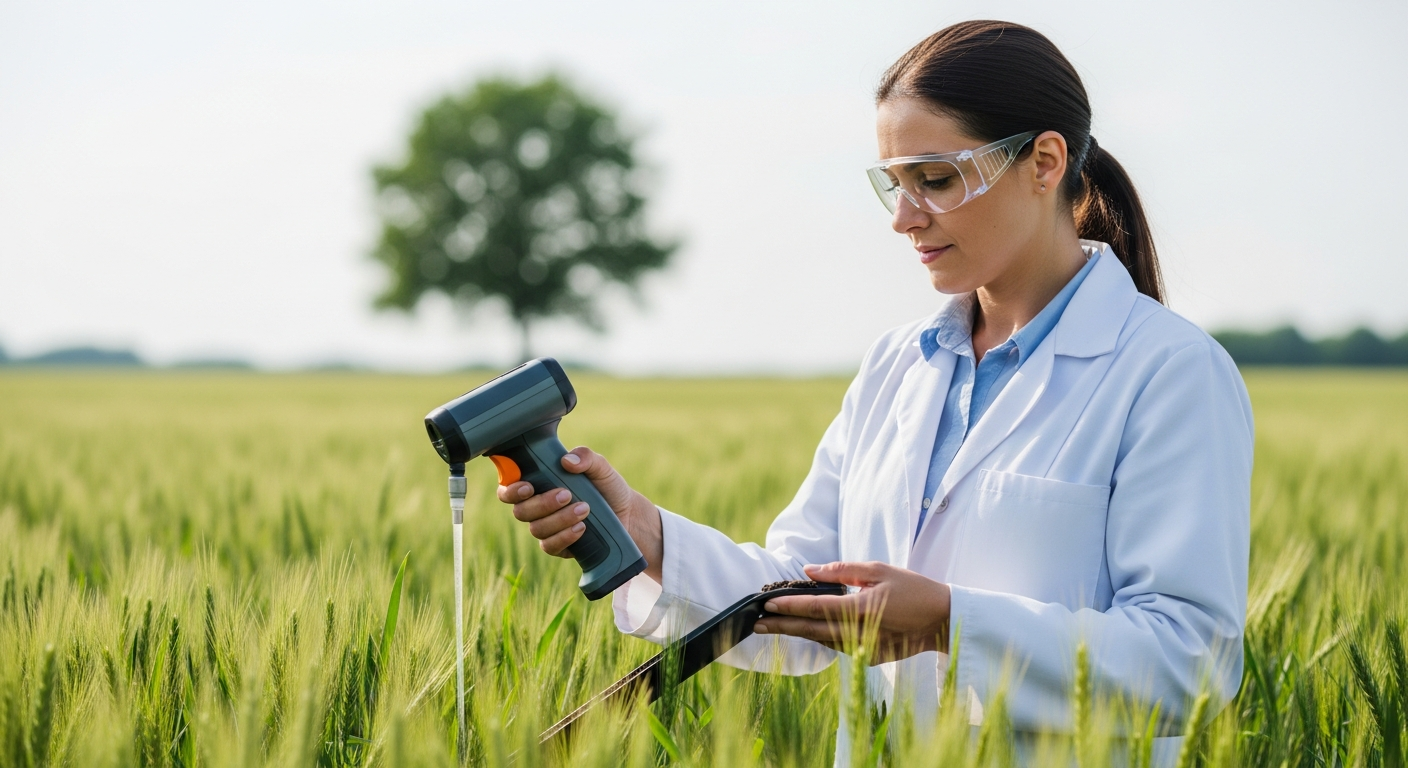
This spectrum is unique to the soil sample and can be used to identify the different components present. The software used to analyze the spectral data employs complex algorithms to correlate the spectral features with known soil properties. These properties can include things like the concentration of nitrogen, phosphorus, and potassium, as well as the amount of organic matter and the soil pH.
The accuracy of soil spectroscopy depends on several factors, including the quality of the spectrometer, the preparation of the soil samples, and the calibration of the spectral models. Regular calibration and validation are essential to ensure that the results are reliable. This often involves comparing the spectral data with traditional soil testing methods.
Furthermore, the interpretation of spectral data requires expertise in soil science and spectroscopy. Farmers may need to consult with specialists to fully understand the results and make informed decisions about crop management. Access to comprehensive databases of soil spectral signatures is also crucial for accurate analysis.
Identifying Plant Stressors Through Spectral Analysis
Plants under stress exhibit distinct spectral signatures that can be detected using spectral analysis. These stressors can range from nutrient deficiencies and water stress to pest infestations and disease outbreaks. By analyzing the spectral reflectance of plant leaves and canopies, farmers can identify these problems early on, allowing for timely intervention.
For example, nitrogen deficiency often leads to a decrease in chlorophyll content, which in turn affects the plant’s ability to absorb light in the red and blue regions of the spectrum. This results in a higher reflectance in the green region, giving the plant a yellowish appearance. Spectroscopic measurements can detect these subtle changes in reflectance, providing an early warning of nitrogen deficiency before it becomes visible to the naked eye.
Similarly, water stress can cause changes in leaf structure and water content, which also affect spectral reflectance. Stressed plants may exhibit a higher reflectance in the near-infrared region of the spectrum. This is because the internal structure of the leaf becomes more disorganized, leading to increased scattering of light.
Pest infestations and disease outbreaks can also alter the spectral properties of plants. For example, fungal infections can cause changes in leaf color and texture, which can be detected using spectroscopy. Some pests also secrete substances that alter the spectral reflectance of plant leaves, providing another avenue for early detection.
Beyond nitrogen and water, other nutrient deficiencies also have unique spectral fingerprints. Potassium deficiency, for instance, can affect the plant’s ability to regulate water, leading to changes in leaf turgor and spectral reflectance. Phosphorus deficiency can impact root development and nutrient uptake, indirectly affecting the overall spectral signature of the plant.
The key to successful stress detection lies in understanding the specific spectral changes associated with each stressor. This requires careful calibration and validation of spectral models using data from plants grown under controlled conditions. Researchers are constantly working to refine these models and develop new techniques for detecting plant stressors using spectroscopy.
Furthermore, the timing of spectral measurements is crucial. Plant stress can manifest differently at different stages of growth. Therefore, it is important to monitor plants throughout the growing season to detect problems early on. Regular monitoring can help farmers identify and address issues before they significantly impact yield.
The use of hyperspectral imaging, which captures spectral data at hundreds of narrow bandwidths, is also becoming increasingly popular for stress detection. Hyperspectral imaging provides a more detailed spectral signature of plants, allowing for the detection of subtle changes that may be missed by traditional spectroscopy. This technology is particularly useful for detecting complex stress interactions.
Using Spectroscopy Data to Assess Crop Health and Vigor
Spectroscopy data provides valuable information about crop health and vigor, enabling farmers to make informed decisions about irrigation, fertilization, and pest control. By monitoring spectral changes over time, farmers can track the progress of their crops and identify potential problems before they impact yield. This proactive approach to crop management can lead to significant improvements in productivity and profitability.
Several spectral indices have been developed to assess plant health and vigor. One of the most widely used is the Normalized Difference Vegetation Index (NDVI), which is calculated from the reflectance in the red and near-infrared regions of the spectrum. NDVI is a measure of green vegetation biomass and is often used to assess crop growth and development.
| Spectral Index | Formula | Application |
|---|---|---|
| NDVI | (NIR – Red) / (NIR + Red) | Assess green vegetation biomass |
| EVI | G (NIR – Red) / (NIR + C1 Red – C2 Blue + L) | Enhanced vegetation index, reduces atmospheric influences |
| SAVI | (NIR – Red) / (NIR + Red + L) (1 + L) | Soil Adjusted Vegetation Index, minimizes soil background effects |
| PRI | (R531 – R570) / (R531 + R570) | Photosynthetic efficiency and stress detection |
Another useful index is the Enhanced Vegetation Index (EVI), which is similar to NDVI but is more sensitive to changes in vegetation biomass in areas with high chlorophyll content. EVI also reduces the effects of atmospheric conditions and soil background, making it more reliable in a wider range of environments.
The Soil Adjusted Vegetation Index (SAVI) is designed to minimize the effects of soil background on vegetation indices. This is particularly useful in areas with sparse vegetation cover or where the soil is highly reflective. SAVI incorporates a soil brightness correction factor to improve the accuracy of vegetation assessment.
The Photochemical Reflectance Index (PRI) is sensitive to changes in photosynthetic efficiency and stress levels in plants. PRI measures the reflectance at two specific wavelengths in the visible spectrum, providing an indication of the plant’s ability to convert light energy into chemical energy. This index is useful for detecting early signs of stress and optimizing irrigation and fertilization practices.
By tracking these spectral indices over time, farmers can create a comprehensive picture of crop health and vigor. Declining NDVI or EVI values may indicate nutrient deficiencies, water stress, or disease outbreaks. Changes in PRI may signal a decrease in photosynthetic efficiency, prompting adjustments to management practices.
The integration of spectral data with other data sources, such as weather data and soil maps, can further enhance the accuracy of crop health assessment. This allows farmers to take a holistic approach to crop management, considering all the factors that may be affecting plant growth and development. Data-driven decisions can lead to significant improvements in yield and profitability.
Integrating Spectroscopy Data with Remote Sensing Technologies
Soil spectroscopy can be effectively integrated with remote sensing technologies to provide a comprehensive view of crop health and soil conditions across large areas. Remote sensing involves the use of satellites, drones, and aircraft to collect data about the Earth’s surface without physically touching it.
These technologies can capture spectral data at high spatial and temporal resolutions, providing valuable information about crop growth, stress levels, and soil properties. By combining soil spectroscopy data with remote sensing data, farmers can create detailed maps of their fields and identify areas that require attention.
For example, drone-based remote sensing can be used to collect high-resolution spectral data of crop canopies. This data can then be used to create maps of NDVI, EVI, and other spectral indices, providing a detailed assessment of crop health and vigor. These maps can be overlaid with soil maps generated from soil spectroscopy data to identify areas where soil properties are limiting crop growth.
Satellite-based remote sensing can provide a broader view of crop conditions across larger regions. Satellites like Landsat and Sentinel collect spectral data on a regular basis, providing valuable information about crop growth, water stress, and disease outbreaks. This data can be used to monitor crop conditions at a regional scale and identify areas that may be at risk of yield losses.
The integration of soil spectroscopy and remote sensing data requires careful calibration and validation. Spectral data collected from different sources may have different characteristics, due to variations in sensor technology, atmospheric conditions, and viewing angles. It is important to correct for these variations to ensure that the data is comparable.
Geospatial analysis techniques can be used to overlay and analyze soil spectroscopy and remote sensing data. This allows farmers to visualize the spatial distribution of soil properties and crop health indicators, identifying areas where management interventions are needed. Geographic Information Systems (GIS) provide a powerful platform for integrating and analyzing these data sources.
The development of cloud-based platforms for processing and analyzing soil spectroscopy and remote sensing data is also facilitating the integration of these technologies. These platforms provide access to powerful computing resources and specialized software, making it easier for farmers to analyze large datasets and generate actionable insights. This democratizes access to advanced agricultural technologies.
Furthermore, the use of artificial intelligence (AI) and machine learning (ML) is transforming the way that soil spectroscopy and remote sensing data are analyzed. AI and ML algorithms can be trained to recognize patterns in the data and predict crop yields, stress levels, and soil properties with high accuracy. This can help farmers make more informed decisions about crop management.
Case Studies: Successful Crop Monitoring Applications
Numerous case studies have demonstrated the effectiveness of soil spectroscopy crop monitoring in improving agricultural practices. In one study, researchers used soil spectroscopy to map soil nutrient levels in a cornfield. They then used this information to develop a variable rate fertilization plan, applying fertilizer only to areas where it was needed.
The results showed a significant increase in corn yield and a reduction in fertilizer use, demonstrating the economic and environmental benefits of this approach. Another study used soil spectroscopy and remote sensing to monitor water stress in a vineyard.
By analyzing spectral data collected from drones, the researchers were able to identify areas where vines were experiencing water stress. They then used this information to develop a targeted irrigation plan, applying water only to the stressed areas. This resulted in a significant reduction in water use and an improvement in grape quality.
A third study used soil spectroscopy to detect disease outbreaks in a wheat field. By analyzing spectral data collected from satellites, the researchers were able to identify areas where wheat plants were infected with fungal diseases. They then alerted farmers to the problem, allowing them to take timely action to prevent the spread of the disease.
In Australia, soil spectroscopy has been successfully used to manage soil salinity in wheat farms. By mapping the spatial distribution of soil salinity using spectral data, farmers were able to implement targeted drainage and irrigation strategies to reduce the impact of salinity on wheat yields. This resulted in significant improvements in productivity and profitability.
In Brazil, soil spectroscopy has been used to optimize fertilizer application in soybean fields. By analyzing spectral data collected from drones, farmers were able to identify areas where soybean plants were deficient in nutrients. They then used this information to develop a variable rate fertilization plan, applying fertilizer only to the deficient areas. This resulted in a significant reduction in fertilizer use and an increase in soybean yields.
In the United States, soil spectroscopy is being used to monitor crop health and vigor in precision agriculture systems. Farmers are using spectral data collected from satellites and drones to track the progress of their crops and identify potential problems before they impact yield. This allows them to make timely adjustments to their management practices, optimizing resource use and maximizing profitability.
These case studies demonstrate the versatility and effectiveness of soil spectroscopy crop monitoring in a wide range of agricultural settings. By integrating soil spectroscopy with other precision agriculture technologies, farmers can make data-driven decisions that improve crop yields, reduce resource use, and enhance environmental sustainability.
Practical Steps for Implementing Soil Spectroscopy
Implementing soil spectroscopy for crop monitoring involves a few key steps. First, you’ll need to define your objectives: what specific information are you hoping to gain about your soil and crops?
Next, collect representative soil samples from your fields, ensuring you cover the variability in soil types and conditions. Analyze these samples using a spectrometer, either through a commercial lab or with your own equipment, if you have it.
- Define clear objectives for your monitoring
- Collect representative soil samples
- Analyze samples using a spectrometer
- Process and interpret the spectral data
- Integrate with other data sources (remote sensing, yield maps)
- Develop targeted management strategies
Process and interpret the spectral data to extract meaningful information about soil properties and plant health. Integrate this data with other sources, such as remote sensing imagery or yield maps, to gain a more comprehensive understanding of your fields.
When defining your objectives, consider the specific challenges you are facing in your farming operation. Are you struggling with nutrient deficiencies, water stress, or disease outbreaks? Identifying your priorities will help you focus your soil spectroscopy efforts and ensure that you are collecting the most relevant data.
The collection of representative soil samples is critical for accurate soil spectroscopy. Use a systematic sampling approach to ensure that you are covering the variability in your fields. Consider dividing your fields into smaller management zones based on soil type, topography, and previous crop performance. Collect multiple samples from each zone and composite them to create a representative sample for analysis.
The analysis of soil samples using a spectrometer can be done in a laboratory or in the field using portable spectrometers. Laboratory analysis provides the most accurate and reliable results, but it can be time-consuming and expensive. Portable spectrometers offer a more convenient and cost-effective option, but they may be less accurate. Choose the analysis method that best suits your needs and budget.
The processing and interpretation of spectral data requires specialized software and expertise. Farmers may need to work with consultants or researchers to effectively analyze their data. The integration of spectral data with other data sources can be done using GIS software. This allows farmers to visualize the spatial distribution of soil properties and crop health indicators, identifying areas where management interventions are needed.
Challenges and Limitations of Soil Spectroscopy
While soil spectroscopy offers numerous advantages, it also has some challenges and limitations. One of the main challenges is the need for accurate calibration and validation of spectral models. Spectral data can be affected by various factors, such as soil moisture, temperature, and particle size.
It is important to develop robust models that can account for these factors and provide accurate predictions of soil properties. Another limitation is the complexity of spectral data. Interpreting spectral data requires specialized knowledge and software.
Farmers may need to work with experts in soil spectroscopy to effectively utilize this technology. Cost can also be a barrier to entry, as spectrometers and specialized software can be expensive. However, the cost of soil spectroscopy is decreasing over time.
The return on investment from improved crop management practices often outweighs the initial cost. Finally, soil spectroscopy is not a standalone solution. It should be integrated with other crop management practices, such as soil testing and visual inspection, to provide a comprehensive assessment of crop health.
The accuracy of spectral models is highly dependent on the quality and representativeness of the calibration data. It is important to collect a large and diverse dataset of soil samples with known properties to train the models. The calibration data should cover the full range of soil conditions that are likely to be encountered in the field.
The influence of soil moisture on spectral data can be significant. Soil moisture affects the reflectance and absorbance of light by soil particles. It is important to account for soil moisture variations when developing spectral models. This can be done by including soil moisture as a variable in the models or by using techniques to normalize the spectral data for soil moisture effects.
The particle size distribution of soil can also affect spectral data. Soil particles of different sizes have different reflectance and absorbance properties. It is important to consider particle size effects when developing spectral models. This can be done by using techniques to separate soil particles by size or by including particle size distribution as a variable in the models.
The cost of soil spectroscopy can be a barrier to entry for some farmers. Spectrometers and specialized software can be expensive. However, the cost of soil spectroscopy is decreasing over time as new technologies are developed. Farmers can also reduce costs by using portable spectrometers or by outsourcing their soil analysis to commercial laboratories.
Future Trends in Spectroscopy-Based Crop Monitoring
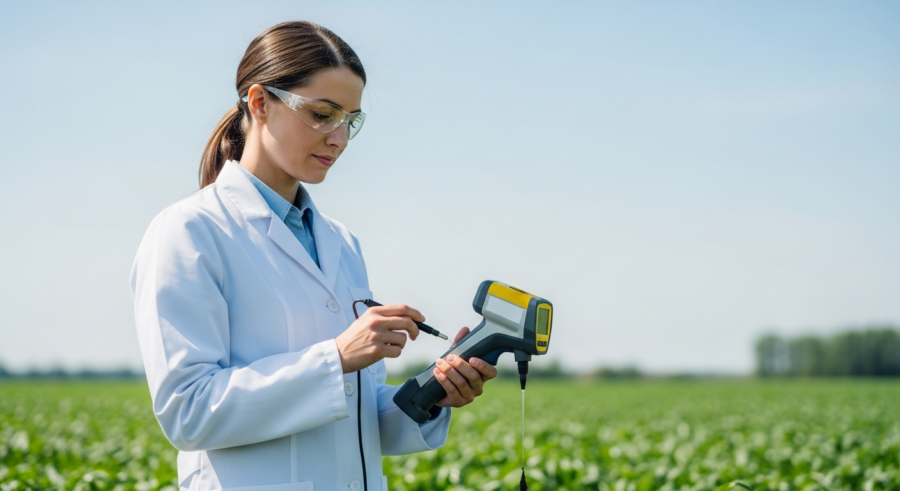
The field of spectroscopy-based crop monitoring is rapidly evolving, with several exciting trends on the horizon. One trend is the development of portable and handheld spectrometers. These devices allow farmers to collect spectral data directly in the field, eliminating the need to send samples to a laboratory.
This can significantly reduce the time and cost associated with soil spectroscopy. Another trend is the use of artificial intelligence (AI) and machine learning (ML) to analyze spectral data. AI and ML algorithms can be trained to recognize patterns in spectral data and predict soil properties and plant health indicators with high accuracy.
This can automate the process of data analysis and interpretation, making soil spectroscopy more accessible to farmers. The integration of soil spectroscopy with other precision agriculture technologies, such as variable rate applicators and automated irrigation systems, is also a growing trend.
This allows farmers to use spectral data to make real-time adjustments to their management practices, optimizing resource use and maximizing yield. Nanotechnology is another area with potential. Nanosensors could be deployed in the soil to provide continuous, real-time monitoring of soil properties, providing even more detailed information for crop monitoring.
The development of more affordable and user-friendly spectrometers is crucial for widespread adoption of soil spectroscopy. Research is focused on developing compact, robust, and easy-to-use spectrometers that can be deployed in the field by farmers with minimal training. These devices will enable farmers to make real-time decisions about crop management.
The use of AI and ML to analyze spectral data is transforming the way that soil spectroscopy is used in agriculture. AI and ML algorithms can be trained to recognize complex patterns in spectral data and predict soil properties and plant health indicators with high accuracy. This can automate the process of data analysis and interpretation, making soil spectroscopy more accessible to farmers.
The integration of soil spectroscopy with other precision agriculture technologies is enabling farmers to make more informed decisions about crop management. By combining spectral data with other data sources, such as weather data, soil maps, and yield maps, farmers can create a comprehensive picture of their fields and identify areas where management interventions are needed. This can lead to significant improvements in crop yields and resource use efficiency.
The development of nanotechnology-based sensors for soil spectroscopy is a promising area of research. Nanosensors could be deployed in the soil to provide continuous, real-time monitoring of soil properties, such as nutrient levels, moisture content, and pH. This would provide farmers with even more detailed information about their soils, enabling them to make more precise management decisions.
Conclusion
Soil spectroscopy crop monitoring is a powerful tool for precision agriculture, offering a rapid, cost-effective, and non-destructive way to assess soil properties and plant health. By integrating soil spectroscopy with remote sensing technologies and other precision agriculture tools, farmers can make data-driven decisions that optimize resource use and improve crop yields.
While there are challenges and limitations to consider, the benefits of soil spectroscopy are clear, and the future of this technology looks bright. As portable spectrometers become more affordable and AI-powered data analysis tools become more accessible, soil spectroscopy is poised to become an essential tool for sustainable and productive agriculture.
The adoption of soil spectroscopy can lead to more sustainable agricultural practices by reducing the use of fertilizers and pesticides. By identifying areas where nutrient deficiencies or pest infestations are occurring, farmers can apply these inputs only where they are needed, minimizing their environmental impact. This can also lead to cost savings for farmers.
The integration of soil spectroscopy with other precision agriculture technologies is essential for maximizing its benefits. By combining spectral data with other data sources, such as weather data, soil maps, and yield maps, farmers can create a comprehensive picture of their fields and make more informed decisions about crop management. This holistic approach to agriculture can lead to significant improvements in productivity, profitability, and environmental sustainability.
Ultimately, soil spectroscopy crop monitoring empowers farmers to become more efficient and sustainable stewards of the land. By harnessing the power of light and data, farmers can optimize their resource use, improve crop yields, and protect the environment for future generations. This technology is a key component of the future of agriculture.