
Soil organic matter is one of those numbers everyone wants, but nobody wants to wait weeks or pay lab prices to get. Near-infrared spectroscopy soil organic matter testing is a practical way to screen lots of samples fast, as long as you treat it like a measurement system and not a magic box.
If you have ever tried to manage nitrogen, irrigation, or residue with only a few lab points per field, you already know the problem. Organic matter can swing hard across a single quarter section, and that swing drives yield stability more than most people admit.
NIR soil analysis works because soils leave a repeatable optical fingerprint when you shine near-infrared light on them. The trick is that the instrument does not directly read “percent organic matter,” it reads light and you translate that into a number using calibration.
This guide focuses on what NIR can and cannot do for organic matter detection, and how to run it in a way that holds up when you compare it to standard lab methods. If you want to use NIR for soil carbon measurement decisions, the details in sampling, prep, and calibration matter more than the brand name on the device.
What near-infrared spectroscopy actually measures in soil
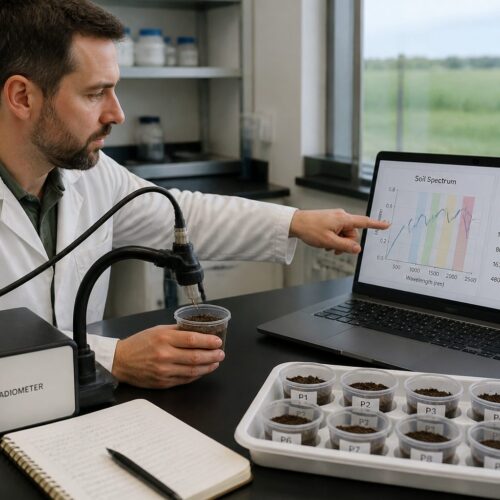
Near-infrared spectroscopy measures how much light a soil sample absorbs and reflects at many wavelengths, usually between about 780 and 2500 nm. The output is a spectrum, which is basically a curve that shows reflectance or absorbance versus wavelength.
The spectrum responds strongly to bonds involving hydrogen, mainly O-H, N-H, and C-H. That is why NIR soil analysis is good at tracking water, clay minerals with hydroxyl groups, and organic compounds that contain lots of C-H.
Soil is messy, so the instrument also “sees” physical effects like particle size, surface roughness, and how tightly the sample is packed. Those effects can shift the baseline and slope of the spectrum, and they can look like chemistry if you do not control them.
Organic matter in soil is not a single molecule, it is a mixture of plant residues, microbial products, and stabilized carbon on mineral surfaces. NIR picks up patterns associated with that mixture, then a model links those patterns to lab-measured organic matter or soil organic carbon.
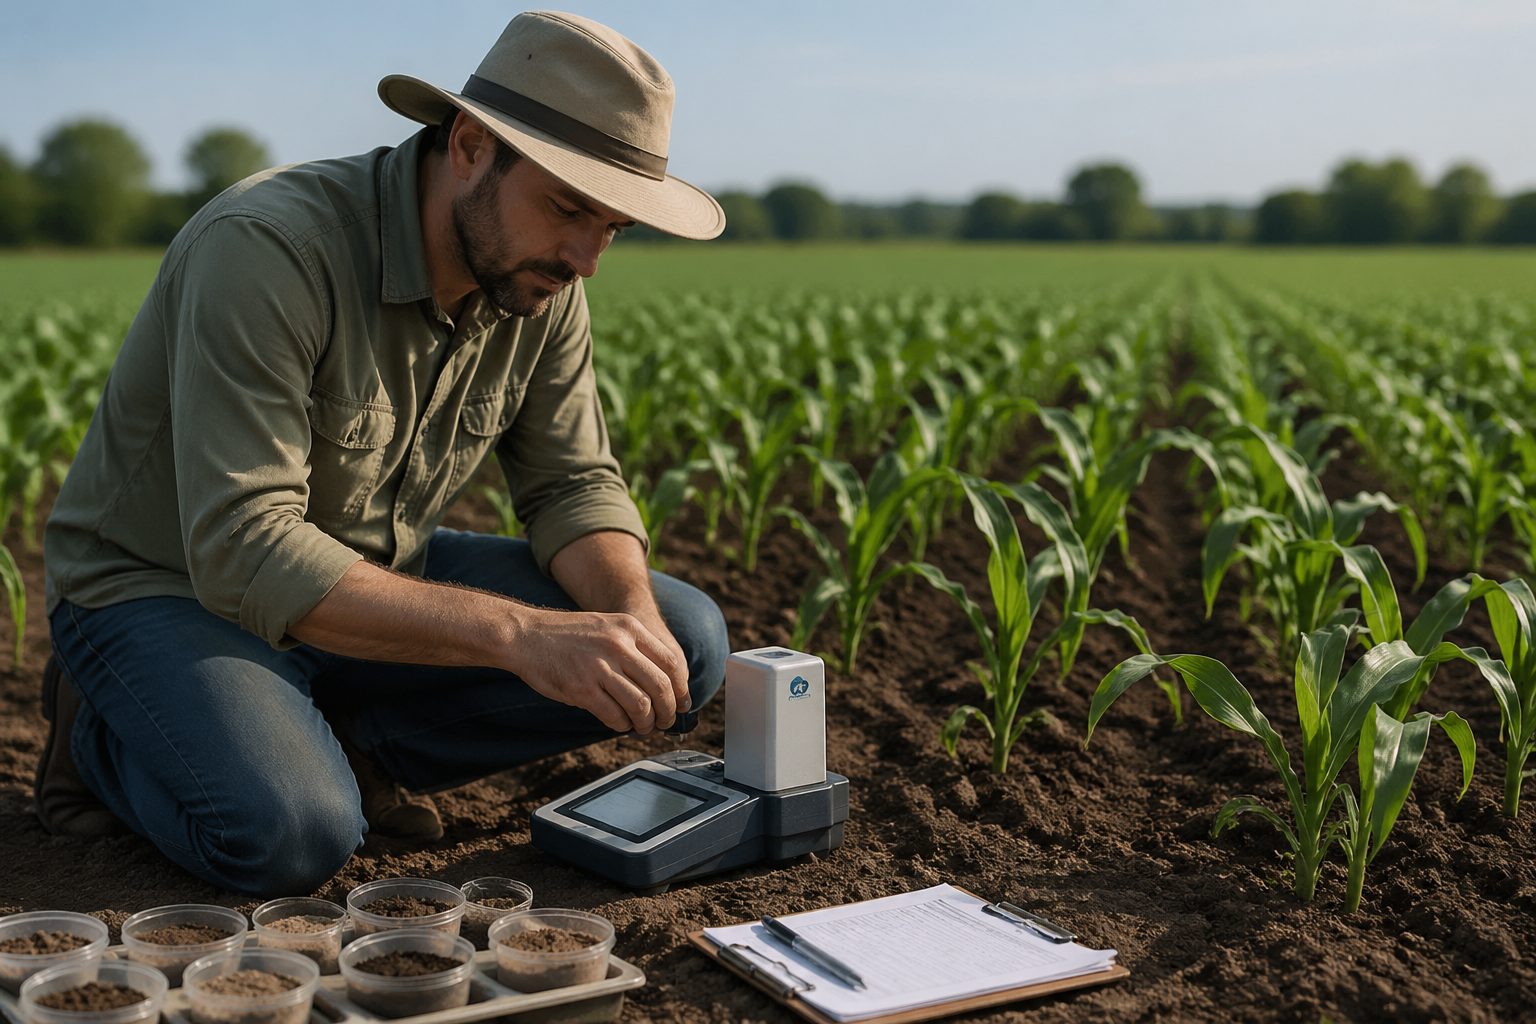
When someone says the instrument “measures organic matter,” what they mean is the model predicts organic matter from the spectrum. If you change soil type, moisture, or management history enough, the same spectrum-to-number relationship may stop working.
The science behind NIR and organic matter detection
Near-infrared light excites overtones and combination bands of fundamental molecular vibrations. These bands are broad and overlapping, so you rarely get a clean “one peak equals one compound” story like you might with mid-infrared.
Organic matter detection with NIR often relies on C-H features and on correlations with other properties that co-vary with organic matter, such as darker color or higher water holding capacity. That correlation can be useful in practice, but it is also where models can get fooled.
For soil carbon measurement, most calibrations target soil organic carbon (SOC) from dry combustion or organic matter from loss-on-ignition. Those reference methods do not match perfectly, so you should know which reference your NIR model was trained on.
Moisture is a big player because water has strong O-H absorption bands that can swamp weaker signals. If you scan field-moist soil, you can still predict SOM, but you need a calibration built for that moisture range and texture mix.
Mineralogy matters too because clays and carbonates change the spectrum in ways that overlap with organic signals. In high carbonate soils, a model that was trained mostly on non-calcareous samples can overpredict organic matter because it confuses carbonate-related features with carbon-related patterns.
How to prepare soil samples for NIR analysis
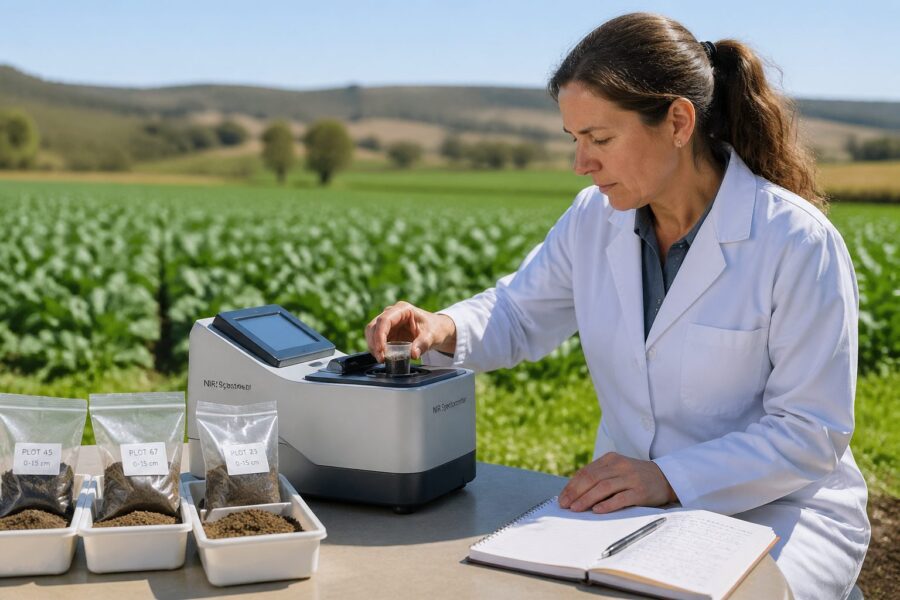
Good sample prep is the cheapest accuracy upgrade you can buy for near-infrared spectroscopy soil organic matter work. If you want results you can defend, aim for consistent moisture, consistent particle size, and clean sample cups.
Most labs dry soils at 35 to 40 C, then grind and sieve to 2 mm, and many go finer for better repeatability. The point is not perfection, it is reducing physical scatter so the spectrum tracks chemistry instead of clods and crumbs.
| Prep step | Common options | How it affects NIR SOM predictions |
|---|---|---|
| Drying | Air-dry, 35 to 40 C oven-dry | Reduces water interference and improves repeatability |
| Grinding | Mortar and pestle, puck mill, cyclone mill | Lowers particle-size scatter and stabilizes baseline |
| Sieving | 2 mm standard, 1 mm for tighter models | Removes rocks and residue chunks that distort spectra |
| Homogenizing | Thorough mixing, split with riffle or cone | Prevents “one scoop” bias in heterogeneous samples |
| Sample presentation | Quartz window cup, rotating cup, fixed cup | Controls path length and reduces packing artifacts |
Calibration models and why they matter for accuracy
The instrument gives you spectra, but the calibration model gives you the organic matter number. If you remember one thing about NIR soil analysis, remember that calibration is the product.
Most soil calibrations use chemometrics like partial least squares regression, sometimes with preprocessing like SNV, MSC, or derivatives. Those steps can improve predictions, but they can also hide problems if the training data do not match your soils.
A strong calibration set covers the textures, mineralogy, carbonate levels, and organic matter range you expect to see. If your farm has sandy outwash and heavy glacial till, you want both in the training set, not just a few token samples.
Validation is where the honesty shows up, and you should ask for independent validation, not just cross-validation. Metrics like RMSEP and bias matter more than a flashy R2, because R2 can look great even when the errors are too big for management decisions.
Model maintenance is real work because sensors drift, lamps age, and software updates change preprocessing defaults. Plan to run check samples, track control charts, and update the model when you expand into new soil types or new management zones.
Portable NIR devices vs. laboratory instruments: which to use
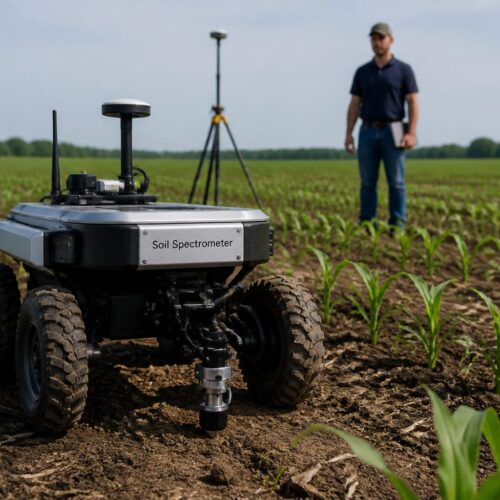
Portable units are tempting because you can scan more points and build maps fast. Lab instruments still win on stability, spectral range, and repeatability, especially when you care about small changes in soil carbon measurement over time.
Many handheld devices cover a shorter wavelength range and have lower spectral resolution than benchtop spectrometers. That does not make them useless, but it does mean you must use calibrations built for that exact sensor family.
If you are doing zone sampling and want to rank areas by organic matter, a portable sensor can be a workhorse. If you are tracking a regenerative practice and trying to detect a 0.2 percent SOM change, I would rather trust a lab workflow with tight prep and controls.
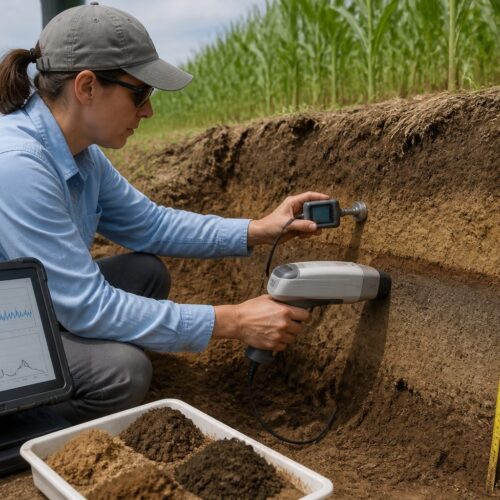
Field scanning on bare soil has practical issues like sunlight leakage, variable contact pressure, and moisture gradients across the surface. You can manage those issues with shields, contact probes, and consistent timing, but you will still see more noise than in a lab.
A hybrid approach often makes the most sense, where portable NIR guides where to sample and the lab confirms the key benchmarks. That keeps costs down while protecting you from making a big fertilizer or manure decision on a shaky prediction.
Interpreting NIR results and common output metrics
NIR reports usually include predicted SOM or SOC, plus model diagnostics that many people ignore. You should read those diagnostics because they tell you whether the prediction is inside the model’s comfort zone or way out on the edge.
Common metrics include predicted value, standard error, and sometimes a confidence interval. Some systems add leverage, Mahalanobis distance, or an outlier flag that warns you when the spectrum does not look like the calibration set.
Pay attention to bias, because a model that consistently overpredicts by 0.3 percent SOM can still show a nice correlation. Bias is especially common when you move a calibration from one region to another with different mineralogy or carbonate levels.
If you are mapping a field, the relative pattern often matters more than the absolute number, at least at first. I like to ground-truth a few high, medium, and low points with a standard lab method, then adjust how much trust I put in the NIR map.
When you compare NIR to lab results, match the reporting basis, such as percent SOM by LOI versus percent SOC by combustion. Mixing those without conversion is a common mistake, and it can make a good NIR model look bad or a bad model look good.
Factors that affect NIR accuracy in the field
Moisture is the first thing that wrecks field accuracy, and it does it fast. Two samples with the same organic matter can scan very differently if one is at 5 percent water and the other is at 20 percent.
Temperature also changes detector response and can change how water sits in the soil matrix. If you scan in the morning and again in the afternoon, you may see drift that has nothing to do with organic matter detection.
Surface conditions matter more than most sales demos admit, because crusting, residue fragments, and stones change scattering. If you want to scan in situ, scrape away residue, level the surface, and keep your contact method consistent.
Soil heterogeneity is the quiet problem, because a single scan covers a tiny area and depth. If you do not composite properly, you are measuring the luck of where you set the probe, not the field zone.
Instrument handling matters too, including warm-up time, dark reference timing, and keeping the window clean. A dusty sapphire window can knock your spectra around enough to look like a real SOM change.
Combining NIR data with other soil tests
NIR is great at speed, but it does not replace every lab test you need to run a farm. The best results come when you pair NIR soil analysis with a few targeted wet chemistry or combustion tests that keep the model honest.
If you run standard soil fertility panels, you can use NIR organic matter maps to decide where to spend money on extra nitrate, sulfate, or micronutrient testing. That approach keeps you from oversampling uniform areas and undersampling the weird parts of a field.
- Confirm NIR SOM with LOI or dry combustion on anchor samples
- Pair SOM maps with pH and buffer pH to guide lime zones
- Add CEC and texture where variable-rate nitrogen is planned
- Use EC mapping to separate salinity from low organic matter signals
- Track bulk density for converting percent SOC into tons per acre
- Run carbonate testing in calcareous fields before trusting SOC predictions
Practical applications for farmers and agronomists
The fastest win is using near-infrared spectroscopy soil organic matter predictions to build better management zones. SOM often lines up with yield stability, water holding, and compaction risk, so it is a smart layer to add early.
For variable-rate nitrogen, SOM is not a direct nitrogen credit, but it is a strong clue about mineralization potential and water stress. I have seen N plans improve when growers stop treating a 1.2 percent SOM sand knob like the 3.0 percent SOM low ground beside it.
Manure and compost planning is another solid use case because you can target low SOM areas without guessing. If you have limited tons to spread, an SOM map helps you spend them where the soil will respond, not where it is easiest to drive.
Cover crop evaluation gets more realistic when you combine NIR scanning with a consistent sampling design over several years. You probably will not see big jumps quickly, but you can spot whether changes trend in the right direction or if the field is stuck.
For soil carbon measurement programs, NIR can cut costs for monitoring, but only if you keep a rigorous lab subset for verification. Carbon markets tend to punish sloppy data, so treat NIR as a screening and scaling tool, then lock the claims to defensible reference tests.
Conclusion
Near-infrared spectroscopy soil organic matter testing can be accurate enough for real agronomy, but only when you control sampling, prep, and calibration. If you skip those steps, you still get a number, but it may not mean what you think it means.
The practical play is to use NIR soil analysis to increase sample density and sharpen field maps, then confirm with a smaller set of lab references. That mix gives you speed without giving up trust, which is what you need when money and yield are on the line.