
Precision agriculture demands a detailed understanding of soil properties, far beyond what a simple surface sample can provide. Capturing the full picture means looking deeper into the earth, using techniques like depth stratified soil sampling spectroscopy profile analysis. This method allows us to uncover the hidden complexities of the soil, ensuring that management decisions are truly informed.
Traditional soil testing often focuses on the top six inches, assuming this shallow layer represents the entire rooting zone. However, this approach overlooks significant variations that occur deeper in the soil profile. Integrating spectroscopy with depth-stratified sampling offers an unparalleled view into these subsurface dynamics.
By dissecting the soil into distinct vertical layers, we gain insights into nutrient availability, organic matter distribution, and water holding capacity at different depths. This detailed information is absolutely necessary for optimizing crop performance and resource use in modern farming systems. It moves us beyond guesswork and into a realm of truly data-driven agricultural practices.
Why Single-Depth Sampling Misses Critical Subsoil Information
Relying solely on surface soil samples for agronomic recommendations is a bit like judging a book by its cover, completely ignoring the complex story within. The upper few inches of soil rarely tell the whole tale of what a crop’s roots encounter as they grow downwards. Significant changes in soil chemistry and physics often occur just below the plow layer.
Nutrients like phosphorus and potassium, while potentially abundant at the surface due to fertilization, can become much less available in the subsoil. Similarly, the distribution of organic matter frequently decreases with depth, impacting nutrient cycling and water retention where deeper roots forage. This stratification means a single surface sample gives a misleading average at best.
Soil pH also changes dramatically down the profile, affecting nutrient solubility and microbial activity in different zones. If a subsoil layer has an acidic pH, it can lock up essential micronutrients, regardless of what the surface sample indicates. Ignoring these deep-seated issues can lead to stunted root development and reduced yield potential.
Furthermore, soil texture and bulk density often vary by depth, influencing water infiltration, drainage, and root penetration. A heavy clay layer just below a sandy loam surface can cause waterlogging or create a barrier for roots, issues completely missed by shallow sampling. This limitation underscores the need for a comprehensive depth stratified soil sampling spectroscopy profile.
Deep-rooted crops, in particular, depend heavily on the resources found in these deeper soil horizons throughout their growing season. If we only manage the topsoil, we are essentially starving the lower parts of the plant, even if the surface looks healthy. A holistic view, obtained through detailed soil depth sampling spectroscopy, supports robust plant growth from top to bottom.
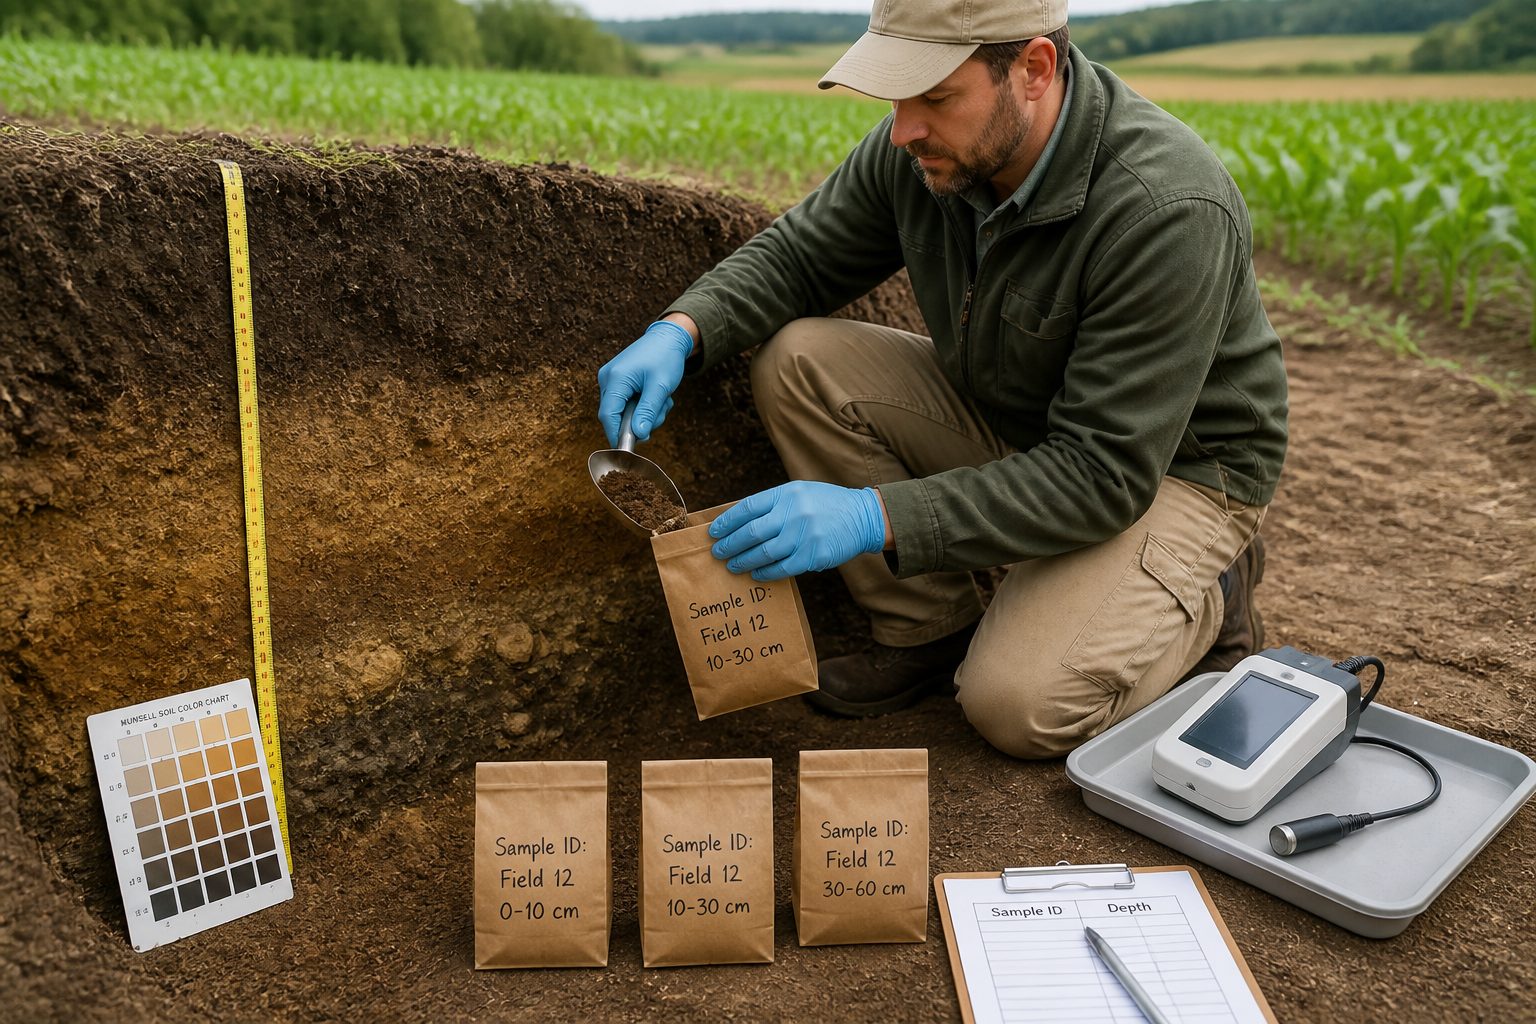
Understanding the full soil profile allows for more precise application of amendments, ensuring they reach the zones where they are most needed. This precision reduces waste, lowers input costs, and minimizes environmental impact from runoff or leaching. It is a smarter way to farm, grounded in better data.
Standard Depth Intervals and When to Deviate From Them
Common practice for depth stratified soil sampling often involves specific intervals designed to capture major changes within the soil profile. These standard depths usually align with typical agricultural practices and crop rooting patterns. However, rigid adherence to these norms can sometimes limit the insights gained.
While 0-15 cm (0-6 inches) and 15-30 cm (6-12 inches) are almost universally sampled, extending to 30-60 cm (12-24 inches) or even deeper is often necessary for a complete understanding. These deeper samples are particularly important for long-season crops or those with extensive root systems. The table below outlines some typical intervals and factors influencing their choice.
| Depth Interval (cm) | Typical Purpose | When to Deviate (Example) |
|---|---|---|
| 0-15 | Surface nutrient management, pH, organic matter | Crop with very shallow roots (e.g., lettuce), or precision top-dressing |
| 15-30 | Subsurface nutrient availability, root growth zone | Perennial crops, deep tillage history, known hardpans |
| 30-60 | Deeper nutrient reserves, water holding capacity | Dryland farming, deep-rooted crops (e.g., corn, alfalfa), irrigation planning |
| 60-90+ | Groundwater interaction, deep-seated nutrient issues | Nitrate leaching concerns, specialized deep-rooted tree crops |
| Based on Horizons | Detailed pedological studies, research plots | Complex soil formation, highly variable parent material |
Deviating from standard intervals becomes essential when specific field characteristics or crop requirements are known. For instance, if you’re dealing with a field that has undergone deep ripping or has a visible hardpan at 20 cm, you would want to sample precisely above and below that layer. This targeted approach provides more actionable data for remediation.
Consider the crop being grown; a shallow-rooted vegetable crop might not require sampling beyond 30 cm, while a deep-rooted perennial like alfalfa benefits immensely from data extending to 90 cm or more. Soil type also plays a role, as sandy soils might show nutrient movement deeper faster than heavy clay soils. Therefore, `soil horizon sampling NIR` can be adapted to specific needs.
Past management practices, such as deep placement of fertilizer or a history of specific cover cropping, should also guide your sampling strategy. If you’ve applied gypsum to address a sodic layer at 45 cm, you absolutely need samples from that depth to monitor its effectiveness. This tailored approach makes the data far more useful.
Ultimately, the goal is to capture meaningful differences in the soil profile that impact plant growth and nutrient dynamics. Sometimes this means using finer intervals, like 10 cm sections, especially in research settings or for very high-value crops. It is about getting the right resolution for your specific questions, rather than just following a rule blindly.
Equipment for Clean Depth-Stratified Core Collection
Collecting clean, undisturbed depth-stratified soil cores is fundamental to obtaining accurate spectroscopic data. The right equipment makes all the difference, ensuring minimal mixing between layers and preserving the integrity of each sample. You absolutely cannot get good data with poor collection methods.
Standard soil probes are often insufficient for true depth stratification because they can smear soil between layers or compress the core. Instead, specialized core sampling tubes with removable liners are much preferred. These tubes allow you to extract an intact soil column that can then be carefully sectioned.
Hydraulic or pneumatic core samplers mounted on ATVs or tractors are ideal for efficiency and consistent core extraction, especially in harder soils. These machines provide the necessary force to push a sampling tube deep into the ground without excessive soil disturbance. Manual probes with foot pedals or sliding hammers are also available for smaller-scale operations or specific conditions.
Once a core is extracted, a core sectioning device is invaluable for precise depth separation. These devices typically consist of a frame that holds the core liner, with guides or clamps that allow you to cut the soil at exact intervals. Using a sharp, thin blade or wire for cutting minimizes smearing between sections.
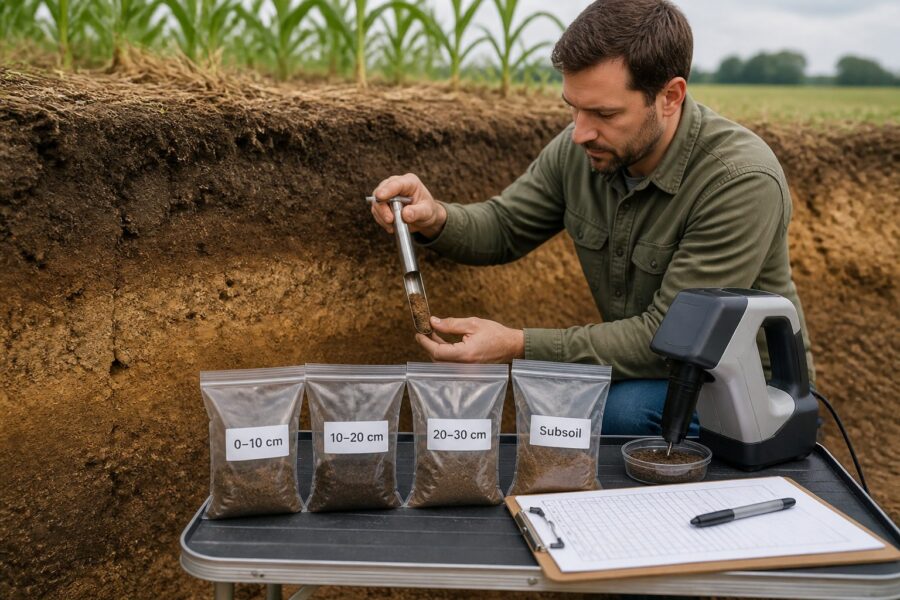
Having plenty of clean, labeled sample bags or containers for each depth interval is also critical. You need to ensure each section goes into its own bag immediately after cutting to avoid any cross-contamination. This simple step prevents a lot of headaches down the line when analyzing the spectral data.
Investing in high-quality tools for depth stratified soil sampling spectroscopy profile collection pays off in the reliability and precision of your data. Better samples mean better models, and better models lead to more accurate agronomic recommendations. Don’t cut corners on the collection phase; it is too important.
Preventing Cross-Contamination Between Depth Layers
Cross-contamination is a silent killer of good soil data, especially when performing depth stratified soil sampling. Even a tiny amount of soil from an adjacent layer can skew your spectroscopic readings and lead to inaccurate conclusions. Maintaining strict protocols during collection and processing is absolutely non-negotiable.
The most important step is to thoroughly clean all sampling equipment between each core extraction and between each depth section. This means wiping down core probes, liners, and sectioning tools with a clean brush or cloth, and ideally rinsing with distilled water. Any residual soil from a previous depth or location can contaminate the next sample.
When extracting the core, try to minimize any twisting or jarring motions that could cause soil layers to mix vertically. A smooth, steady push or pull is best, allowing the core to enter the liner cleanly. If the soil is particularly wet or sticky, this becomes even more challenging and requires extra care.
During the sectioning process, use a clean, sharp knife or spatula to separate the soil layers precisely at the desired depth intervals. Cut straight across the core, making sure not to drag soil from one section into the next. Some technicians even remove a thin sliver of soil from the cut surface to ensure a completely uncontaminated interface.
Immediately place each separated depth section into its own clearly labeled, clean sample bag or container. Do not allow samples from different depths to touch each other, even briefly, on a work surface. Using separate gloves for handling each section can also add an extra layer of protection against contamination.
Proper storage and transport of samples are also part of preventing contamination. Keep all samples sealed and upright, and if possible, store them in a cooler to minimize microbial activity that could alter spectral properties. These meticulous steps ensure the integrity of your `stratified soil core spectroscopy` efforts, providing reliable data for analysis.
How Spectral Signatures Change With Depth and What That Means
The beauty of `soil depth sampling spectroscopy` lies in its ability to detect subtle yet significant shifts in soil composition as you move down the profile. Every component in the soil has a unique spectral fingerprint, and these fingerprints change dramatically with depth. These variations are not just academic; they directly impact how crops grow and how we should manage them.
Organic matter content typically decreases with depth, leading to a corresponding reduction in absorption features associated with organic compounds in the visible and near-infrared (VNIR) range. This change is one of the most prominent spectral indicators of depth. The list below highlights key factors influencing spectral shifts.
- Organic matter content decreases
- Clay content often increases
- Moisture levels fluctuate
- Iron oxide concentrations vary
- Mineralogy shifts
- Carbonate presence changes
- Particle size distribution alters
Clay minerals, for example, often become more concentrated in deeper horizons, showing stronger absorption bands in specific NIR regions related to water and hydroxyl groups. These changes indicate different water retention capacities and nutrient exchange properties at varying depths. Knowing where these changes occur helps predict soil behavior.
Iron oxides, which give many soils their reddish or yellowish hues, can also vary in concentration and type with depth, profoundly influencing spectral reflectance. Different forms of iron oxides have distinct spectral features, providing clues about soil drainage and aeration conditions. These are critical for understanding root environments.
Moisture content is another major driver of spectral response, and its distribution changes significantly down the soil profile, especially after rainfall or irrigation. Wet soils absorb more light across the spectrum, making them appear darker, while dry soils reflect more. This information is key for precise irrigation scheduling.
Beyond these, mineralogy itself can shift, with different parent materials or weathering processes leading to distinct mineral assemblages at various depths. Spectroscopy can identify these mineralogical changes, providing insights into the long-term fertility and physical properties of the soil. It is like reading a geological history book.
Understanding these depth-specific spectral signatures allows us to build robust calibration models for various soil properties at different depths. This means we can predict not just surface organic carbon, but also subsoil clay content or deep-profile moisture, all from spectral data. This level of detail completely transforms soil management.
Building a Depth Profile Map From Multiple Scan Points
Collecting a single depth-stratified soil sampling spectroscopy profile provides a detailed vertical slice of the soil at one point. To truly optimize field management, we need to extend this understanding across the entire landscape. This involves aggregating data from multiple scan points to create a comprehensive 3D map of soil properties.
Imagine a grid laid over your field, with depth-stratified cores taken at each intersection or at strategically chosen variable rate zones. Each core yields spectral data for multiple depth intervals, providing a rich dataset. This systematic collection forms the foundation for mapping subsurface variability.
Once the spectral data from all depth sections and all sampling points are collected, they are processed using chemometric models calibrated to predict specific soil properties. These models translate the complex spectral fingerprints into tangible values like organic carbon percentage, clay content, or pH for each depth. This step is where the magic happens, turning light into numbers.
Geostatistical techniques, such as kriging or inverse distance weighting, are then applied to interpolate these predicted soil properties between the actual sampling points. This creates continuous maps for each depth layer, showing how a specific property varies horizontally across the field at a given depth. You can visualize the field at 0-15 cm, then at 15-30 cm, and so on.
Combining these individual depth maps allows us to construct a full 3D representation of the soil, illustrating how properties change both horizontally and vertically. This `stratified soil core spectroscopy` approach reveals hidden patterns of variability that would be impossible to detect with traditional methods. You can see pockets of high clay at 40 cm, or areas with low organic matter at the surface but high levels deeper down.
These 3D soil property maps are incredibly powerful tools for precision agriculture. They inform variable rate application prescriptions for nutrients, lime, or even irrigation, ensuring that inputs are applied exactly where and at the depth they are needed. This level of spatial and vertical precision minimizes waste and maximizes efficiency, truly putting the “precision” in precision agriculture.
Reporting Depth-Stratified Spectral Data for Agronomic Interpretation
Generating accurate depth-stratified spectral data is only half the battle; effectively reporting and interpreting it for agronomic decision-making is equally important. The raw spectral curves themselves are complex and not easily understood by most farmers or even many agronomists. The data needs to be translated into actionable insights.
Reports should clearly present the predicted soil properties for each depth interval at every sampling location. This can be done through tables that list values for organic carbon, pH, cation exchange capacity, and nutrient levels for 0-15 cm, 15-30 cm, and deeper sections. Numerical summaries provide the hard facts.
Visualizations are absolutely key to making this complex data digestible. Creating a series of 2D maps, one for each depth interval and each soil property, allows for easy identification of spatial variability at different depths. For example, a map of subsoil pH can reveal acidic zones that might be limiting deep root growth.
Profile charts or graphs that show the change in a specific soil property with depth at a given point are also incredibly useful. These vertical graphs immediately highlight stratification patterns, such as a sharp drop in organic matter or a rise in clay content below the plow layer. This visual representation makes the `depth stratified soil sampling spectroscopy profile` intuitive.
Agronomic interpretation should go beyond simply reporting numbers; it needs to provide context and recommendations. For example, if subsoil nitrate levels are high, the report might suggest adjusting nitrogen application rates or timing for the next crop. If a deep hardpan is detected with high bulk density, recommendations for deep tillage or cover cropping might follow.
The report should integrate these findings with crop specific needs and local environmental conditions. A good report translates the spectral data into practical advice on variable rate fertilization, irrigation scheduling, soil amendment strategies, and even crop selection. This comprehensive approach empowers growers to make truly informed decisions that optimize yield and sustainability.
Conclusion
Adopting depth stratified soil sampling spectroscopy profile methods represents a significant leap forward for precision agriculture. Moving beyond superficial analysis allows us to uncover the intricate details of our soil, leading to far more effective and sustainable management practices. This approach provides a level of insight traditional methods simply cannot match.
By understanding how soil properties vary vertically and horizontally, growers can make smarter decisions about every aspect of crop production. This precision reduces input waste, improves resource efficiency, and ultimately contributes to healthier soils and more resilient farming systems. It is an investment in both productivity and environmental stewardship.
The integration of advanced sampling techniques with powerful spectroscopic analysis empowers agronomists and farmers with unparalleled data. This detailed knowledge allows for tailored solutions that address specific field challenges at the right depth, leading to optimized yields and reduced environmental impact. The future of soil management is undoubtedly deep and spectrally rich.