
Understanding soil health is fundamental for profitable, sustainable agriculture. For too long, gauging soil quality felt like a guessing game, relying on slow lab tests and subjective field observations.
However, recent advancements in spectroscopy are changing this, offering a rapid, objective way to assess and track soil health. We can now build a comprehensive spectroscopy soil health scoring index that gives farmers clear, actionable data.
This article explores how spectral data can power a practical soil score card, moving beyond raw numbers to create a meaningful spectral soil quality indicator for better farm management.
What Makes a Useful Soil Health Index for Decision-Making
A truly useful soil health index goes beyond raw data, offering clear interpretation and direct relevance to farm operations. It must provide actionable recommendations, guiding farmers on how to improve specific soil aspects and translating into management actions like adjusting fertilizer rates or choosing cover crops. This direct linkage from score to action greatly enhances its practical value.
It must offer a holistic view, combining various soil properties into a single, understandable metric. This simplifies complex information, allowing quick comparisons across fields or over time for busy farm managers.
The index should be cost-effective and timely, providing results quickly enough to influence in-season decisions. Traditional lab analyses often take too long, limiting their impact for immediate adjustments.
It needs to be sensitive enough to detect subtle soil changes before they become major problems. Early detection allows proactive intervention, preventing yield losses and improving resource efficiency.
Accuracy and reproducibility are non-negotiable for any effective spectroscopy soil health index. Farmers rely on consistent results to build trust and make sound long-term plans.
The index should be adaptable to diverse soil types, climates, and cropping systems. A one-size-fits-all approach rarely works in agriculture, so flexibility is key.
Ultimately, a successful spectroscopy soil health scoring index empowers farmers with data-driven decisions, enhancing productivity and environmental stewardship. It transforms abstract science into practical tools.
It should also facilitate benchmarking, allowing farmers to compare their soil health against regional averages or best practices. Such comparisons offer valuable context and motivate continuous improvement.
Transparency in its methodology is crucial, ensuring farmers understand score derivation and component representation. This builds confidence and encourages greater adoption of the spectral soil quality indicator.
Moreover, the index should be scalable for both small and large commercial farms. This broad applicability ensures spectroscopy benefits reach a wide range of agricultural producers.
Finally, a useful index fosters a deeper understanding of soil as a living system, encouraging regenerative practices. It shifts focus from reacting to problems to proactively nurturing soil vitality.
Spectral Properties That Correlate With Biological and Physical Health
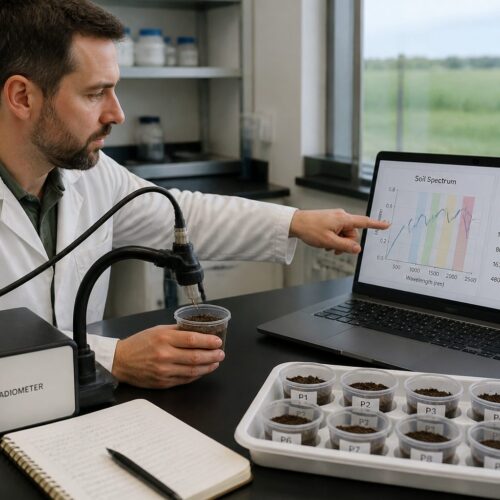
Spectroscopy measures how light interacts with soil, providing a unique fingerprint of its composition and condition. Wavelengths are absorbed, reflected, or transmitted based on organic matter, mineral content, and moisture.
Spectral signatures directly correlate with key soil health indicators, including biological activity and physical structure. Organic carbon, for instance, strongly influences spectral absorption, indicating nutrient cycling capacity.
VNIR absorption features are sensitive to soil color, often a proxy for organic matter. Darker soils typically absorb more light, signaling higher organic carbon levels.
SWIR absorption bands are associated with water molecules, allowing precise determination of soil moisture. This is vital for understanding water availability and plant stress.
Clay minerals (e.g., kaolinite, smectite) exhibit characteristic SWIR features due to their crystal structures and bound water. These are crucial for assessing soil texture and cation exchange capacity.
MIR spectroscopy offers greater specificity, identifying functional groups within organic molecules (carbohydrates, proteins, lipids). This detailed information provides insights into soil organic matter quality and stability.
Carbonates and silicates, indicative of parent material and pH, produce unique MIR spectral responses. These mineralogical insights are fundamental for understanding soil fertility and buffering capacity.
Spectral analysis can indirectly infer biological activity by detecting changes in organic matter composition and nutrient availability, direct results of microbial processes. A shift in organic functional groups might indicate active decomposition.
Physical health parameters like aggregate stability, porosity, and bulk density correlate with spectral data, often through organic matter and clay content. Stronger aggregates tend to have higher, spectrally detectable organic carbon.
| Spectral Range | Key Soil Property Indicated | Relevance to Soil Health |
|---|---|---|
| Visible (400-700 nm) | Soil Color, Iron Oxides | Indicates organic matter content, drainage, and aeration. |
| Near-Infrared (NIR) (700-2500 nm) | Organic Carbon, Water Content, Clay Minerals | Crucial for nutrient retention, water holding capacity, and microbial activity. |
| Mid-Infrared (MIR) (2500-25000 nm) | Organic Functional Groups, Carbonates, Silicates | Provides detailed insights into organic matter quality, mineralogy, and pH. |
| Thermal Infrared (TIR) (8000-14000 nm) | Soil Temperature, Mineral Composition | Influences biological processes and helps identify specific mineral types. |
Existing Scoring Frameworks and How Spectroscopy Feeds Into Them
Many existing soil health scoring frameworks rely on physical, chemical, and biological tests. These often include metrics like organic matter, aggregate stability, pH, nutrient levels, and microbial biomass.
Popular examples include the Cornell Soil Health Assessment, the Haney Test, and various state-specific soil quality indicators. Each assigns scores to parameters, then combines them into an overall soil score card.
Spectroscopy offers a powerful, non-destructive way to rapidly measure many parameters simultaneously. A single spectral scan can provide data for numerous soil properties, replacing multiple lab tests.
NIR spectroscopy can accurately predict soil organic carbon, total nitrogen, and cation exchange capacity. This speed and efficiency make it ideal for large-scale soil health monitoring, offering a practical spectroscopy soil health scoring index.
MIR spectroscopy provides more detailed information on soil mineralogy and organic matter composition. This allows a deeper understanding of soil structure and biological activity, enhancing any spectral soil quality indicator.
Integrating spectral data into these frameworks means replacing slow, expensive lab tests with quick, affordable spectral predictions. This drastically reduces the time and cost for comprehensive soil health assessment.
A soil health index spectroscopy approach streamlines data collection, enabling more frequent, widespread sampling. This leads to better spatial resolution of soil health across fields, invaluable for precision agriculture.
Spectroscopy acts as a powerful proxy, leveraging correlations between spectral signatures and lab-measured values for accurate estimations. This bypasses laborious wet chemistry for routine assessments.
This technology also allows assessment of dynamic properties, like soil respiration or enzyme activity, by observing organic matter changes over time. Such real-time insights were previously difficult and expensive.
Standardizing the measurement process, spectroscopy reduces variability from different lab procedures, leading to more consistent, comparable results across regions. This consistency is crucial for large-scale soil health initiatives.
The non-destructive nature of spectral analysis means samples can be retained for further investigation or analyzed in situ for immediate field results. This flexibility adds utility to the system.
Integrating spectral data with other geospatial technologies (GPS, remote sensing) further enhances its value in precision agriculture. This allows high-resolution soil health maps that guide variable rate applications.
How to Build a Simple Field-Level Scoring System From Spectral Data
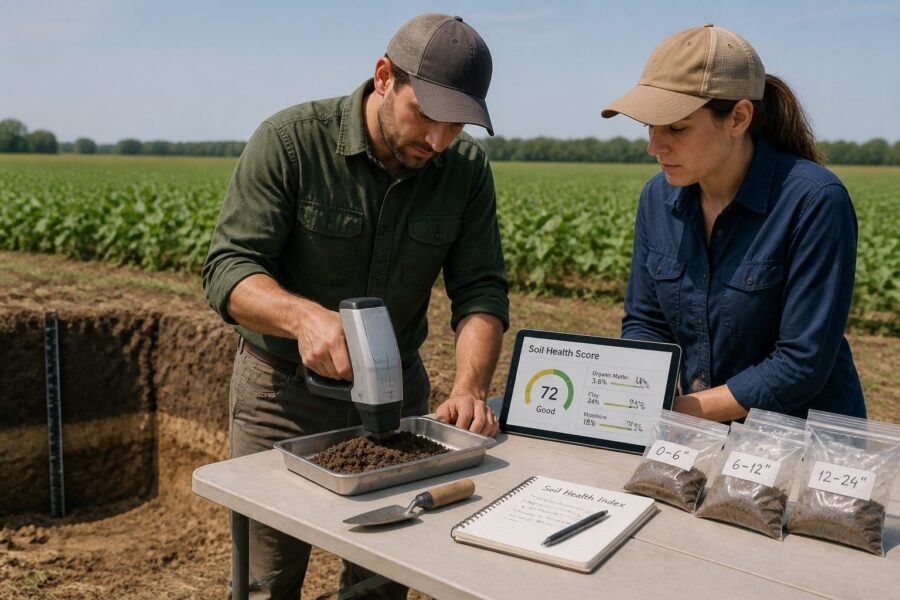
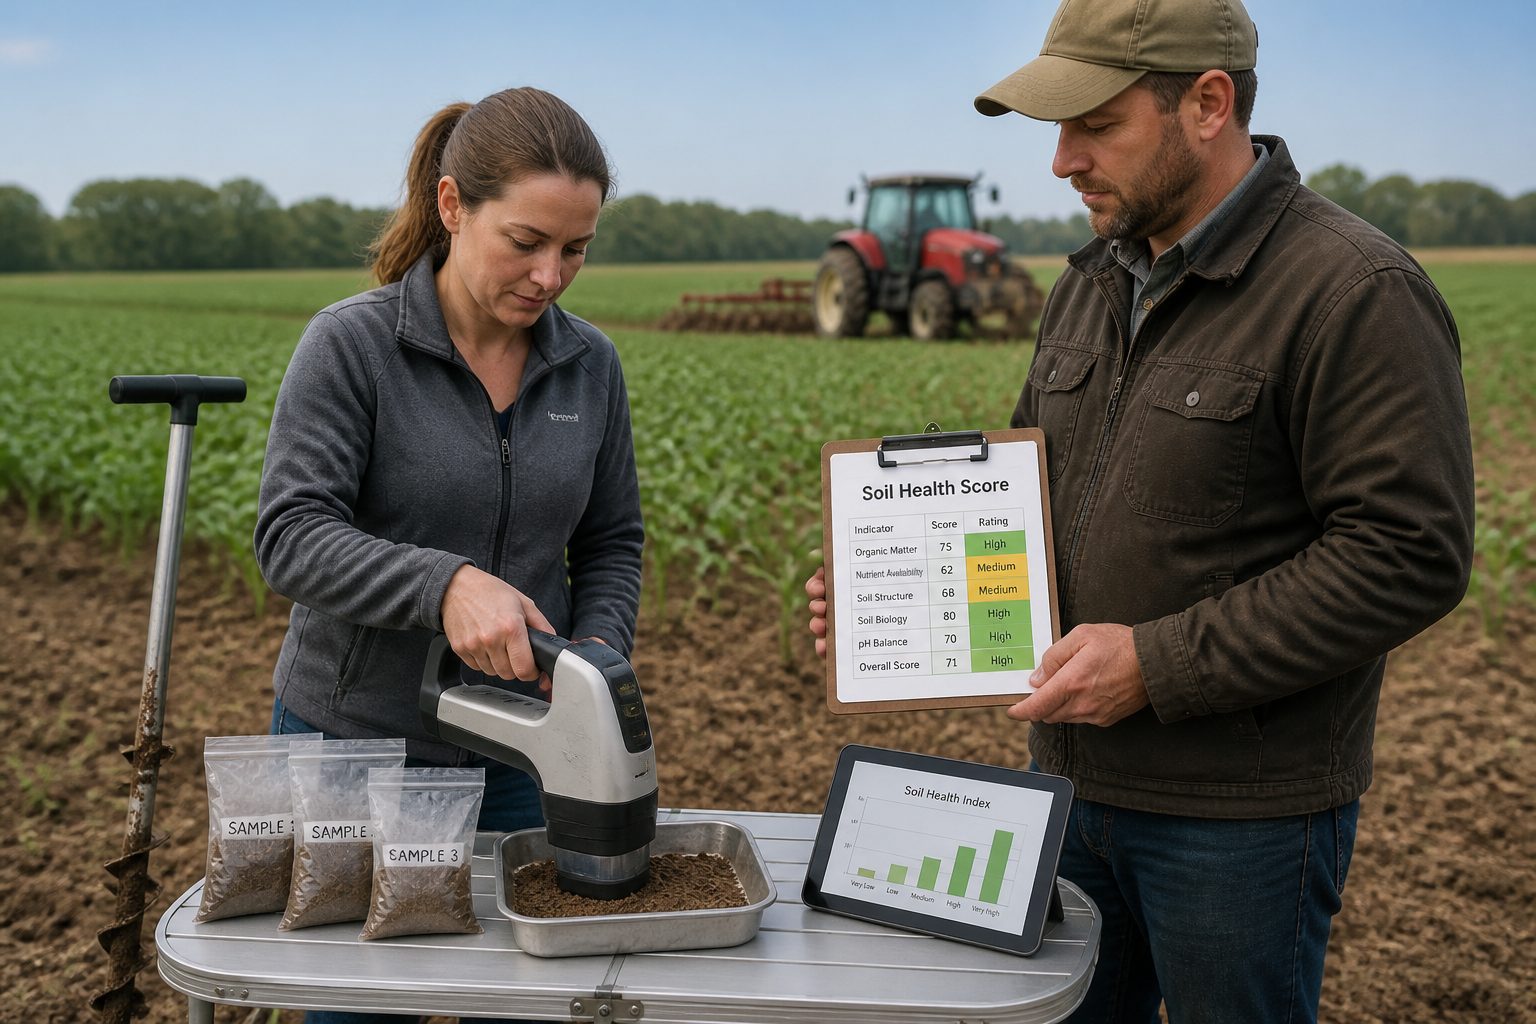
Building a simple, effective field-level scoring system from spectral data requires a clear, step-by-step approach. The goal is to translate complex spectral information into an intuitive, easily understandable soil score card.
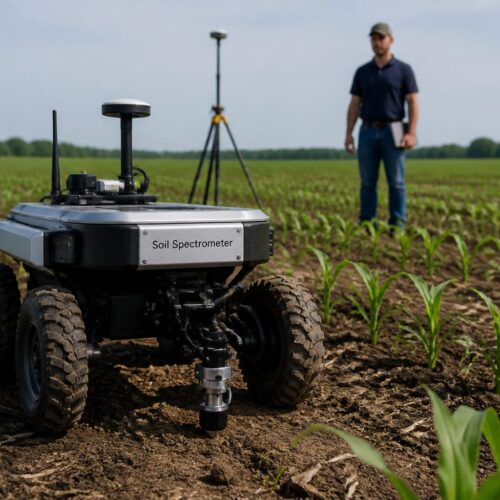
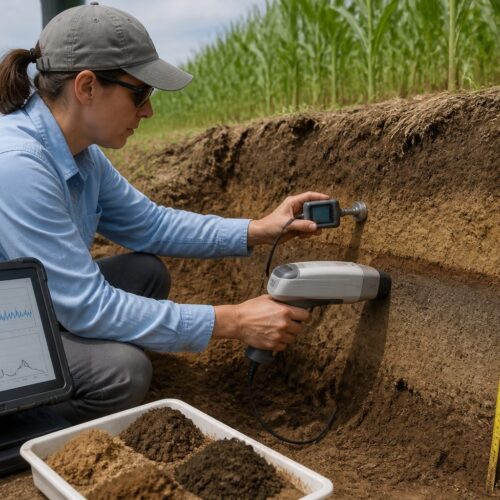
First, collect representative soil samples and analyze them using a portable spectrometer. These devices provide rapid spectral readings directly in the field or from dried samples.
Next, use robust calibration models to convert raw spectral data into predictions for key soil health indicators. These might include organic carbon, pH, aggregate stability, and available nutrients, forming your spectroscopy soil health scoring index.
Select a manageable set of 5-7 core indicators most relevant to your specific crops and management goals. Too many indicators can overcomplicate the system, making it less useful for practical farm decisions.
Assign a scoring scale (e.g., 1-5 or 1-10) to each indicator, where higher numbers represent better soil health. Define clear thresholds for “poor,” “fair,” “good,” and “excellent” for each parameter, specific to regional soil types.
Calculate an overall soil health score by averaging or weighting individual indicator scores. Weighting emphasizes properties more critical for your farming system, creating a tailored spectral soil quality indicator.
Visualize scores on a field map using GIS software, creating zones of varying soil health. This spatial representation helps farmers identify problem areas and target management precisely, optimizing resource allocation.
Prediction accuracy relies heavily on high-quality calibration data, typically correlating spectral readings with traditional lab analyses on diverse local soil samples. Regular recalibration ensures robust, relevant models.
Incorporate machine learning algorithms to refine calibration models and improve spectral data’s predictive power. Advanced algorithms uncover subtle relationships between spectral signatures and soil properties, enhancing the spectroscopy soil health scoring index.
When defining thresholds, collaborate with local agronomists and soil scientists to ensure they reflect local conditions and crop requirements. Generic thresholds may not accurately capture agricultural nuances.
Ensure the scoring system is dynamic, allowing adjustments to indicator weights or thresholds as new research emerges or farming goals evolve. Flexibility is key to maintaining the spectral soil quality indicator’s long-term utility.
Finally, establish a clear protocol for data collection and analysis, including sampling density and spectrometer operation, to ensure consistency and reliability. This standardization is vital for accurate year-over-year comparisons and trend analysis.
Weighting Indicators: Which Properties Matter Most for Your Crop
Not all soil health indicators hold equal importance across different crops or farming systems. Deciding which properties matter most is critical for developing a truly useful spectroscopy soil health scoring index.
For example, a corn grower might prioritize organic carbon and nitrogen availability, while a vineyard manager focuses on soil structure and drainage. Proper weighting ensures the soil score card reflects your operation’s specific needs.
The economic impact of a soil property on yield or input costs heavily influences its weighting. Indicators directly affecting profitability should be prioritized in the overall score.
Environmental concerns, like nutrient runoff or carbon sequestration potential, might also dictate higher weighting for certain indicators in sustainable farming. This reflects a broader commitment to ecological stewardship.
Expert knowledge from agronomists and local extension services is invaluable in determining appropriate weights for soil health parameters. Their experience with regional soils and crops provides essential context.
Consider your soil type’s inherent variability; sandy soils might emphasize water holding capacity, while heavy clay soils prioritize aggregate stability. Tailoring weights to soil type enhances relevance.
Reviewing historical crop performance data in relation to soil properties can reveal most limiting or beneficial factors. This empirical evidence provides a strong basis for informed weighting decisions.
The weighting scheme for your spectral soil quality indicator should not be static, but re-evaluated periodically as management practices evolve or new crop varieties are introduced. Adaptability ensures the index remains relevant and effective.
- Identify primary limiting factors for your target crop
- Consult local extension agents or agronomists
- Review historical yield data versus soil test results
- Consider soil type and climate constraints
- Prioritize indicators that respond to management practices
Tracking Score Changes Over Seasons as a Management Feedback Loop
The real power of a spectroscopy soil health scoring index emerges when tracking scores over multiple seasons. This longitudinal data creates a vital feedback loop, showing the direct impact of management practices on soil health.
Comparing year-to-year scores, farmers can see if efforts like cover cropping, reduced tillage, or organic amendments genuinely improve soil quality. This objective feedback validates successful strategies and identifies areas needing adjustment.
A consistent soil health index spectroscopy program allows adaptive management, where decisions are continuously refined based on observed changes. This proactive approach optimizes inputs and protects long-term productivity.
If your soil score card shows declining organic matter, you might increase cover crop biomass or diversify your rotation. Conversely, improving scores could justify reducing synthetic fertilizer, saving money and benefiting the environment.
Tracking helps differentiate between natural seasonal variations and genuine management-caused trends. Understanding these patterns prevents overreactions to short-term fluctuations, allowing more stable decision-making.
This continuous monitoring acts as an early warning system, highlighting potential degradation before it significantly impacts yields. Promptly addressing issues minimizes economic losses and environmental damage, a huge win for farmers.
Ultimately, this feedback loop transforms soil health management from a static concept into a dynamic, data-driven process. It empowers farmers to truly understand their soil and adapt strategies for sustained success, building a robust spectral soil quality indicator.
Long-term data sets from consistent spectral analysis reveal the cumulative effects of regenerative practices, demonstrating their value over many years. This evidence is crucial for promoting sustainable agriculture.
Benchmarking against historical data or neighboring fields provides context for current scores, helping farmers understand if their progress is above or below average. This insight can further motivate improvements.
/wp:paragraph –>The feedback loop supports experimental farming, allowing producers to test new practices on small plots and quickly assess their impact on soil health before scaling up. This reduces risk and accelerates innovation.
By demonstrating clear soil health improvements, farmers can gain access to sustainability programs, carbon credits, or premium markets. The spectral soil quality indicator provides verifiable proof of environmental stewardship.
This continuous learning process, driven by objective data, fosters a deeper connection between farmers and their land, promoting stewardship that benefits the farm’s bottom line and the ecosystem.
Communicating Spectral Health Scores to Non-Technical Stakeholders
Spectral health scores offer immense value, but their impact is limited if not clearly communicated to all stakeholders. Farmers, landowners, investors, and consumers need to grasp their meaning.
Simplifying complex data into easily digestible formats is paramount. Avoid jargon and focus on translating scores into tangible benefits like increased yields, reduced input costs, or improved water quality, resonating with a broader audience.
Visual aids like color-coded maps, simple bar charts, or trend lines are incredibly effective. A green zone on a field map immediately conveys good health, while red zones indicate areas needing attention, making the spectroscopy soil health scoring index intuitive.
Develop a clear “report card” format for your soil score card, assigning grades or descriptive terms like “Excellent,” “Good,” “Fair,” or “Needs Improvement.” This familiar structure helps non-technical stakeholders quickly understand overall status.
Connect the spectral soil quality indicator directly to economic outcomes. Show how improved soil health, measured by spectroscopy, translates into higher profits or lower environmental risks, appealing to financial interests.
Use real-world examples and comparisons to make data relatable. Explaining a certain score means the soil can hold X more inches of water or reduce nutrient runoff by Y percent makes the abstract concrete for stakeholders.
Finally, offer clear, actionable recommendations alongside the scores. Instead of just presenting a low score, suggest specific practices to improve it (e.g., planting a cover crop or adjusting irrigation schedules), providing real value to farmers.
Tailor your communication strategy to the specific audience; a landowner might be interested in long-term asset value, while a farm worker needs practical instructions. Different stakeholders require different levels of detail and focus.
Building trust is essential, so be transparent about data collection methods and underlying science, without overwhelming stakeholders with technicalities. Emphasize the reliability and objectivity of the spectroscopy soil health scoring index.
Consider interactive dashboards or mobile applications that allow stakeholders to explore data themselves, fostering engagement and ownership. This empowers them to delve deeper into the spectral soil quality indicator at their own pace.
Highlight success stories and positive trends to build momentum and encourage further adoption of soil health practices. Demonstrating tangible benefits through clear communication inspires others.
Effectively communicating these insights bridges the gap between advanced scientific measurement and practical farm management, ensuring widespread adoption of sustainable agricultural practices.
Conclusion
Integrating spectroscopy into soil health assessment represents a significant leap for precision agriculture. A robust spectroscopy soil health scoring index empowers farmers with unprecedented insights into their most valuable asset.
This technology moves beyond traditional, time-consuming lab methods, offering a rapid, cost-effective, and detailed understanding of soil conditions. It allows more proactive, targeted management decisions, leading to better outcomes.
Developing a practical soil score card from spectral data involves carefully selecting indicators, weighting them appropriately, and tracking changes over time. This creates a powerful feedback loop for continuous farm improvement.
Clearly communicating these complex spectral soil quality indicator scores to all stakeholders, from field workers to investors, ensures widespread adoption and understanding. This makes the science accessible and actionable.
Embracing spectroscopy for soil health scoring is not just about new technology; it’s about fostering a more sustainable, profitable, and resilient agricultural future. This is a game-changer for land management.
The transition to spectral soil health assessment promises to unlock new levels of efficiency and environmental stewardship, driving agricultural innovation. It represents a paradigm shift in how we perceive and manage vital soil resources.
By providing immediate, comprehensive data, spectroscopy enables farmers to optimize resource use, reduce environmental impact, and enhance long-term farm viability. This leads to a more resilient food system.
Ultimately, a well-implemented spectroscopy soil health scoring index is a cornerstone of modern, data-driven agriculture, offering a clear path towards sustainable and profitable farming globally.